ICC Conference 2021
Take that Flood: Does your Perspective Matter?
Abstracts of the International Cartographic Association 2021, International Cartographic Conference, Dec. 14-18, 20201, Florence, Italy,
Abstracts of the International Cartographic Association 2021, International Cartographic Conference, Dec. 14-18, 20201, Florence, Italy,
Abstract
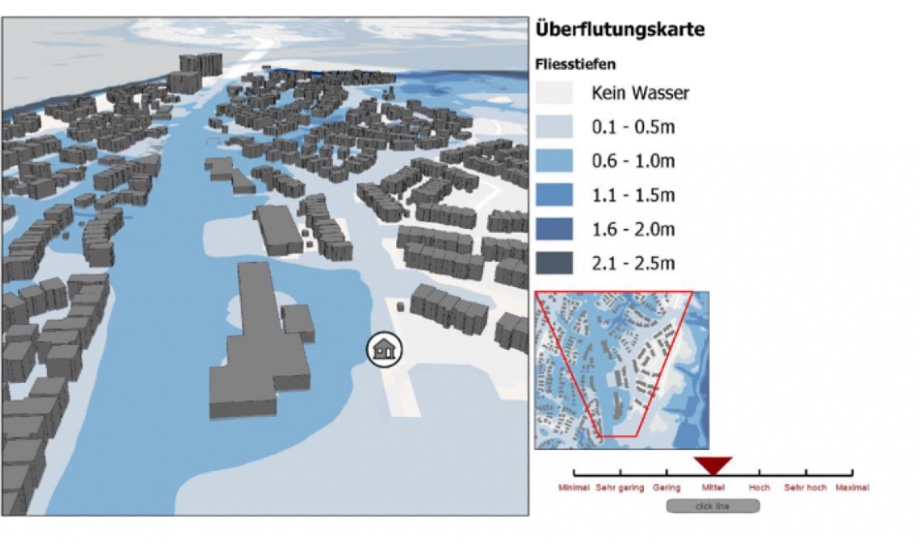
The growing frequency of significant flood events as one of the effects of global climate change, highlights the increased importance of using appropriate communication methods to inform the general public about the risks to human life and to the environment (Hagemeier-Klose & Wagner, 2009). To raise public flood risk awareness, authorities typically produce 2D flood hazard maps. In the U.K., however, only 45% of the population living in flood risk areas are indeed aware of this hazard, for instance (Rollason et al. 2018). Perhaps current 2D flood hazard maps have limited impact in raising public risk awareness because the target audience may have difficulty in interpreting abstract, static, 2D displays of a dynamic volumetric process (Haynes et al., 2007)? Current research is still undecided on whether static, abstract 2D or more realistic, interactive 3D visualizations should be used to communicate environmental hazards or risk (Macchione et al. 2019, Leskens et al., 2017). We aim to move a step closer towards closing this research gap, by empirically studying how the display perspective of static flood maps might influence human risk perception, thus purposefully excluding interactivity, and any other 3D visualization options. More specifically, we set out to firstly empirically assess human risk perception of static, orthographic perspective (2D) and oblique perspective (2.5D) flood maps (between-subject), and secondly, how individual risk attitudes might influence risk perception of the visualized floods. Using two viewing perspectives, Figure 1 depicts a set of test map stimuli of an identical flood event in Virginia