#121: How to make health care service provision more equitable and greener
Big mobility data are being generated on a daily basis. How can they help to make road transportation greener, safer, and accessibility to services such as health care more equitable? Within the Horizon2020 project Track&Know we have developed big data technology and demonstration studies.
-
- different scenarios
- The Track&Know dashboard allows to visualize and compare different spatial configurations of facility locations. In the foreground, we see the current facility locations (blue markers) and the optimally placed new locations (green markers). The algorithm seeks to optimally place the facilities with respect to the demand population shown in the background. Hence, the solutions in the left panel (OSA risk population) and in the right panel (patient population) are different.
Vehicles engaged in road traffic today are equipped with GPS tracking devices on a routine basis. Naturally, any sort of position tracking of vehicles (and thus persons!) raises issues of privacy and data security. There are, however, application domains where such concerns are outweighed by the benefits that can accrue through the use of tracking technology.
One of these domains is fleet management, where large vehicle fleets, for instance, of delivery services or trucking companies, can be monitored. In this way, the movements of vehicles are optimized to reduce fuel consumption and at the same time speed up delivery times. Similarly, in the health sector, GPS tracking allows to guide and optimize dispatching of ambulances. Alternatively, mobility analytics allows to study the accessibility of health care services for a particular population, and thus improve the equity in the delivery of such services.
In the EU Horizon 2020 project Track&Know 14 partner groups - technology partners, academic partners, and application partners - joined forces to develop technology and computational methods that enable big mobility data analytics applications such as the above.
Long travel distance can be a barrier to diagnosis and treatment
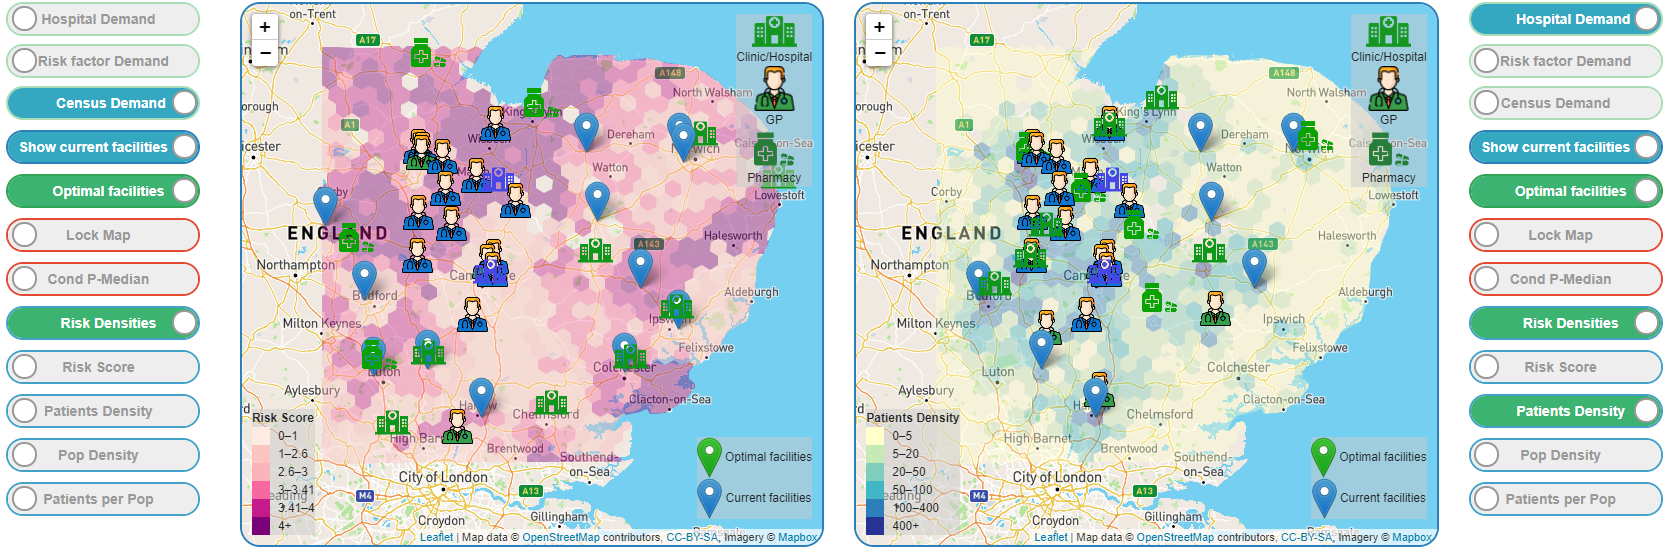
Among the tasks addressed by the GIS unit at GIUZ was the development of an application for optimizing the locations and spatial accessibility of health care services. We collaborated with the Royal Papworth Hospital, which provides testing and treatment for 'obstructive sleep apnoea' (OSA), a major cost-intensive public health concern. Up to 85 % of the OSA population are estimated of going undiagnosed. Poor accessibility of OSA facilities due to long travel distance can be a barrier to diagnosing and treating patients in the UK.
Several risk factors are known to be associated with OSA, e.g. age and obesity. We incorporated them into a model showing the uneven distribution of the population potentially at risk of suffering from OSA. Combining the risk model with the travel times allows to highlight areas of deprivation. Typically, these areas tend to be more rural and/or peripheral, with a combination of a population that is older than average, has more weight problems, and is living further away from centers on the countryside. This leads to higher rates of undiagnosed and untreated OSA, and thus to a poorer health condition.
Re-arrangement of facilities would bring substantial efficiency gains
Given these maps of the status quo, the question was then how the access to OSA testing facilities could be improved. We developed an optimization model that computed new, or additional facility locations such that the overall travel distances and times could be minimized for a given population in demand of health care. For instance, for the risk population a mere 10 facilities would suffice to obtain the same demand-weighted average travel distance from patients' homes as for the currently 27 OSA testing facilities! Conversely, optimally re-arranging the same number of 27 facilities, the average travel distance could be almost halved to 10.2 km instead of 19 km. This dramatic gain in efficiency is largely due to the fact that the current network of OSA testing facilities has grown historically, without much consideration of its spatial layout.
Of course, one might argue that it is unrealistic to completely re-arrange all facilities, because after all they represent physical infrastructure with trained staff. Therefore, the optimization model also allows adding few but optimally placed facilities, while keeping the existing facilities fixed. Using this approach, adding 5 facilities to the 27 existing ones still leads to a reduction of the demand-weighted average travel distance from 19 km to 12.6 km, or one third.
More equitable and greener: A classical win-win situation
Through this optimization approach, health care service provision could be made more equitable: The additional health care facilities are placed in the currently underserviced, deprived areas with a high population that is potentially at risk. In addition, they could be made greener: Reduced travel distances not only lead to better service accessibility, but also to less fuel consumption and CO2 production. A classical win-win situation.
Our application has found great interest from other health care providers within the NHS and beyond. To a good deal, this was also due to the interactive dashboard front-end developed by our research assistant Livio Brühwiler, which allows to vividly demonstrate the functionality and impact of such an evidence-based approach. Relying on spatial data enables more equitable and greener health service planning and management.
Webinar presenting the Track&Know Health Care Service Optimization application: talks start at 16:55; interactive dashboard demo at 40:10 to 50:50.
Hubler, Loris (2019): Facility location modeling scenarios to optimize obstructive sleep apnoea health facilities in the East of England. MSc Thesis, Dept. of Geography, University of Zurich.
Track & Know is a Horizon2020 project and an acronym for "Big Data for Mobility Tracking Knowledge Extraction in Urban Areas". Track & Know aims to introduce innovative software stacks and toolboxes addressing new emerging cross-sector markets related to automotive transportations and urban mobility, e.g. healthcare management. GIUZ is one of the project partners and collaborates among others with the Royal Papworth Hospital (RPH). RPH is part of the UK National Health Service system and the leading center for respiratory diseases in the East of England. The case of their obstructive sleep apnoea testing facilities was used to study the provision of health care services to the population. |
Weitere News
- #125: Der 125. und letzte
- #124: Gletscher vor 125 Jahren und heute
- #123: Ist das Navi in der Hand der erste Schritt zum betreuten Wohnen?
- #122: In eine neue Welt katapultiert
- #120: Unsere Welt ist eine multidimensionale Collage
- #119: Is Tourism the Beginning or the End? Livelihoods of Georgian Mountain People at Stake
- #118: «Wir müssen den Klimawandel systematisch als Risiko mitdenken»
- #117: Andean mountain regions: Fragile sentinels of landscape and cultural transformation
- #116: Temporary streams at the doorsteps of Irchel Campus
- #115: Schneeflocken vom Weltraum aus zählen
- #114: Provokation und Revolte am GIUZ
- #113: Ambitious goals for biodiversity urgently needed!
- #112: "The Eyes Have It!" - Where we look while navigating
- #111: Investigating plants genetic structure from above
- #110: «I see and I remember. I do and I understand.»
- #109: «Für uns, unsere Kinder und Kindeskinder»
- #108: Was macht die Digitalisierung mit unserer Umwelt?
- #107: The role of a developer at GIUZ
- #106: Dem unterirdischen Wasser auf der Spur
- #105: Was der Geographieunterricht zur Bildung im 21. Jahrhundert beitragen kann
- #104: Nepal - Kein Land für alte Leute?
- #103: Klimawandel in der Schweiz: Alles, was du wissen musst!
- #102: Wie Instagram unseren Umgang mit der Natur verändert
- #101: Numbed by navigation technologies: How can we counteract?
- #100: Das ist der 100. Blogbeitrag
- #99: Investigating food sustainability: from production and trade to consumption
- #98: Geographers live in concert - postponed!
- #97: Global Glyphosate: Uneven Geographies of herbicide production and use
- #96: "Pesticides burned grass and know-how"
- #95: Vier Standorte in 125 Jahren
- #94: Dietikon: Vom Bauerndorf zur Stadt
- #93: What is biodiversity?
- #92: Feldarbeit im ruralen Nepal: Reflektion zu Positionalität, Verantwortung und Rollen
- #91: Das Schulfach Geographie: heute und morgen
- #90: Funktionale Diversität aus dem Weltraum kartieren
- #89: Adieu ewig’ Eis
- #88: Landschaftsleistungen erlebbar machen
- #87: What is the role of variability in nature?
- #86: The Skin of Chitwan
- #85: Animated flight line collection over Switzerland
- #84: Space, Nature & Society: Wo wir forschen und was wir tun
- #83: Do you know about the 3MT competition?
- #82: An academic career in ecology
- #81: Hunderte Studierende verzaubern den Semesterstart an der Uni Zürich
- #80: Wie bewegen wir uns in Zukunft fort?
- #79: Willkommen im GEO- und ESS-Studium!
- #78: Expedition vom Fenster aus: Wie nimmst du deine Umgebung wahr?
- #77: Mitten in der Pandemie eine historische Pandemie untersuchen
- #76: Das Geoteam stellt sich vor
- #75: How roots influence climate change
- #74: Imaging the earth from above
- #73: Studierende sammeln Daten: Natur, Landschaft und Ressourcen
- #72: Trouvaillen aus dem Archiv
- #71: The fluorescence of phytoplankton from 800 km above
- #70: Der kalte Norden ist auch familiär
- #69: How the COVID-19 pandemic is teaching us to tackle the climate crisis
- #68: Studierende sammeln Daten: Migration, Mobilität und Stadt
- #67: Sommerpause!
- #66: On the art of failing forward
- #65: Die Wasserstadt Zürich mit dem Smartphone entdecken
- #64: Auf den Spuren der ersten Schweizer Polarforscher
- #63: Geistreiche Wortspiele
- #62: Von Gemüse über Milch bis zu Kaffee: Solawis in der Deutschschweiz
- #61: Berner Seeland - quo vadis?
- #60: Intense days on the field course to Val Piora
- #59: Panta rhei - alles fliesst
- #58: Comic Strip Geographies
- #57: Where we come from
- #56: A journey through time with loess deposits
- #55: Schlacht am Morgarten 1315: Wie sah die Landschaft damals aus?
- #54: Berne going green
- #53: Biochar increases rice root architecture
- #52: Velo- und Fussverkehr in der Corona-Zeit
- #51: The impact of Covid-19 from an economic geography perspective
- #50: Why do we create virtual forests?
- #49: Wenn das Eis fehlt: Das Lötschental und seine Zukunft
- #48: Wie Skitouren geplant werden: Big Data gibt Einblicke
- #47: Is there a place for people in protected areas?
- #46: Artenvielfalt im Irchelpark
- #45: Cress, tomatoes and the meaning of the universe
- #44: Scientific games to understand social-ecological system dynamics
- #43: Insight into the WGMS
- #42: Connecting female hydrologists worldwide: an initiative born at GIUZ
- #41: Maximilian schickt dich einkaufen
- #40: Sars-CoV-2 and food producers: who cares?
- #39: The value of water
- #38: Mit Slimy-Masse die Gletscherschmelze illustrieren
- #37: Was machen Geographinnen und Geographen nach dem Studium?
- #36: Geographie-Student Jonathan, der Erdball und die CO2-Männli
- #35: Zwei Studiengänge am Geographischen Institut
- #34: Urban Sustainability as New Financial Fix?
- #33: Stillschweigend im Verborgenen
- #32: Interaktiv und interdisziplinär
- #31: Unpacking the complexity of social-ecological systems
- #30: Der Landschaft lauschen
- #29: Synergien zwischen Homeschooling und Hochschullehre schaffen
- #28: The first fully remote PhD defenses
- #27: Der Weltwassertag fällt ins Wasser
- #26: Die GIUZ Sustainability Task Force
- #25: Was ist Geographie?
- #24: «Geografe nüme schlafe!»
- #23: Auf dem Weg zur 2000-Watt-Gesellschaft
- #22: Spatial genetics for plant-based communities - and much more!
- #21: Strebergärtli - Irchel Garden Project
- #20: Writing papers - a nightmare. Or not?
- #19: Urbanisierte Landschaften - Leben zwischen Natur und Zivilisation
- #18: Atmende Wälder in 3D
- #17: «Wir sind hier, wir sind laut!»
- #16: Was ist EGEA?
- #15: Exploring the future of biodiversity
- #14: Lawinenbulletins in den Alpen: Konsistenz über die Landesgrenzen hinweg
- #13: Ein Kaffee aus der Eiszeit
- #12: Grönland 1912 - und heute!
- #11: «Wir sitzen alle im selben Boot»
- #10: Monitoring und Reduktion von Flugreisen am GIUZ
- #9: Der Verein Geographie Alumni UZH: Ein Forum für alle Geographieinteressierten
- #8: Wissen in Bildern - Informationsdesign heute
- #7: Geographie in Aufruhr
- #6: Gletschermessreihen mit Mayonnaise
- #5: Landkarten im Reduit
- #4: Die Plastiksuppe kartieren
- #3: Neue Abteilung «Space, Nature and Society»
- #2: Wie alles begann
- #1: Alles Gute zum 125. Geburtstag