#64: Tracing the tracks of the first Swiss polar explorers
A chronology of the changes on the western edge of the Greenlandic ice sheet since the Swiss expedition of 1912: historical maps and aerial photographs, but also satellite data, drone photographs and GPS measurements form a bridge to today's climate research.
-
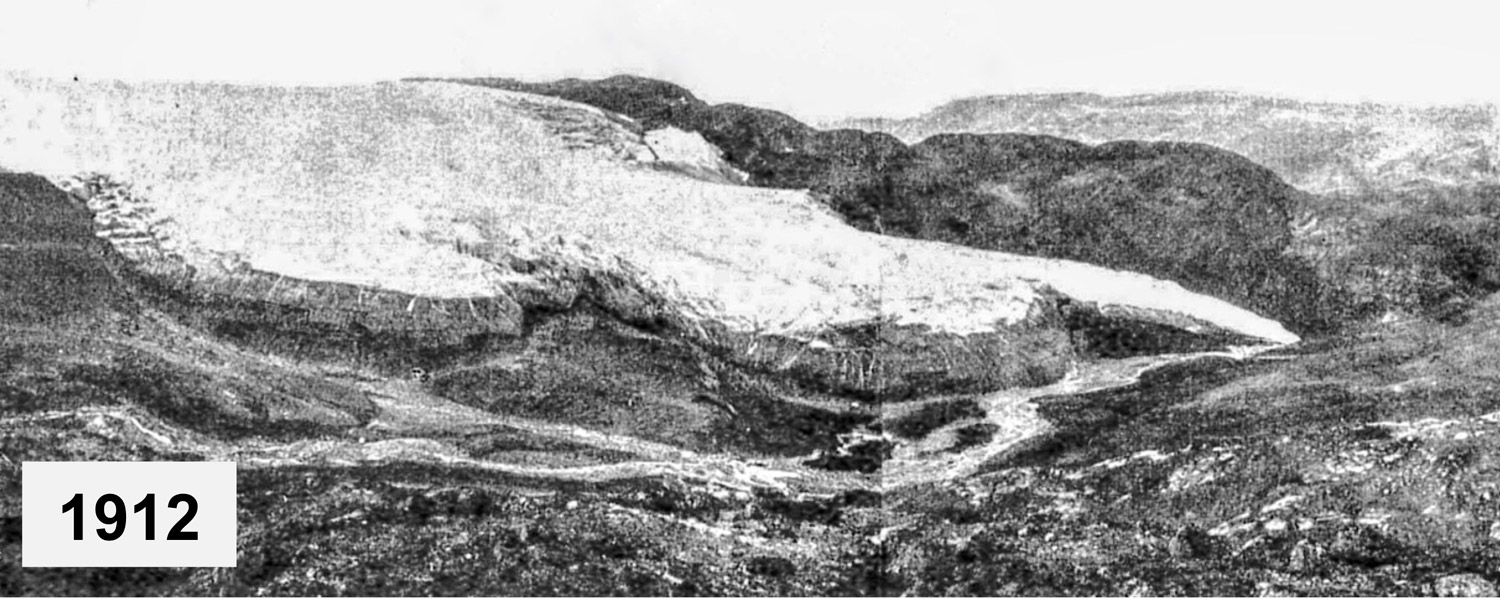
Sermeq Kujalleq 1912 and 2018
-
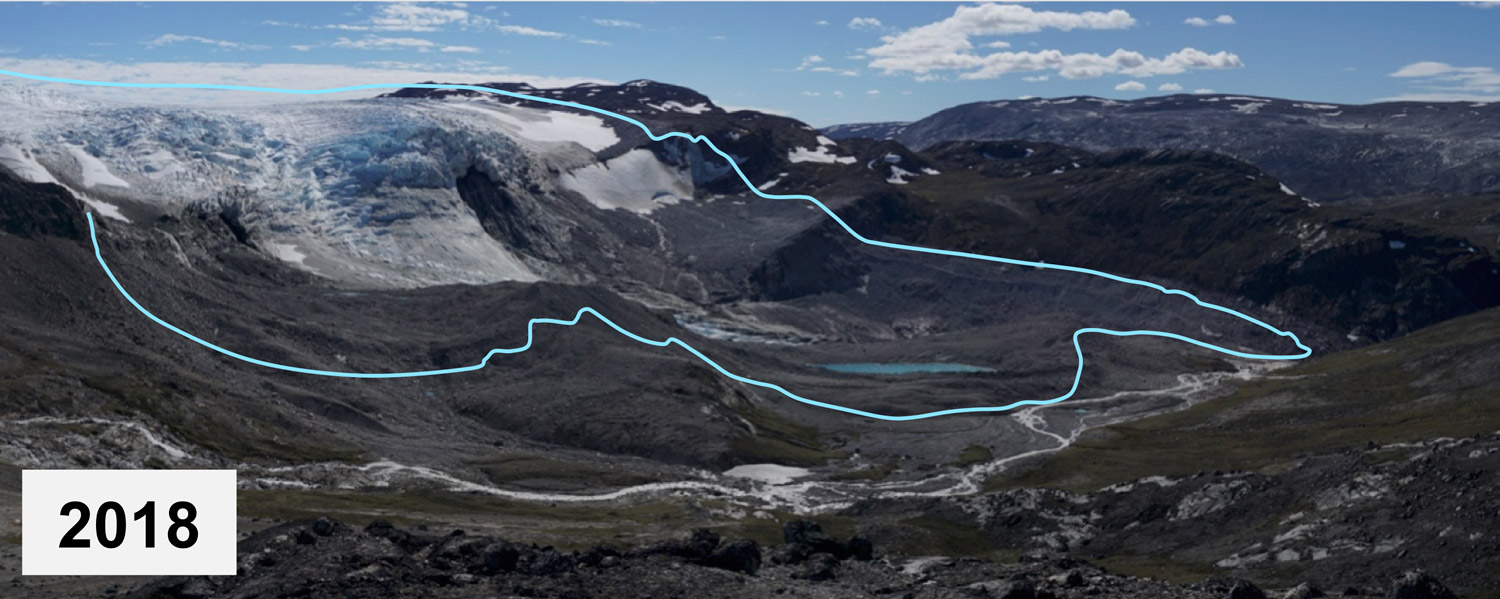
Sermeq Kujalleq 1912 and 2018
Ice sheet margins are rarely explored
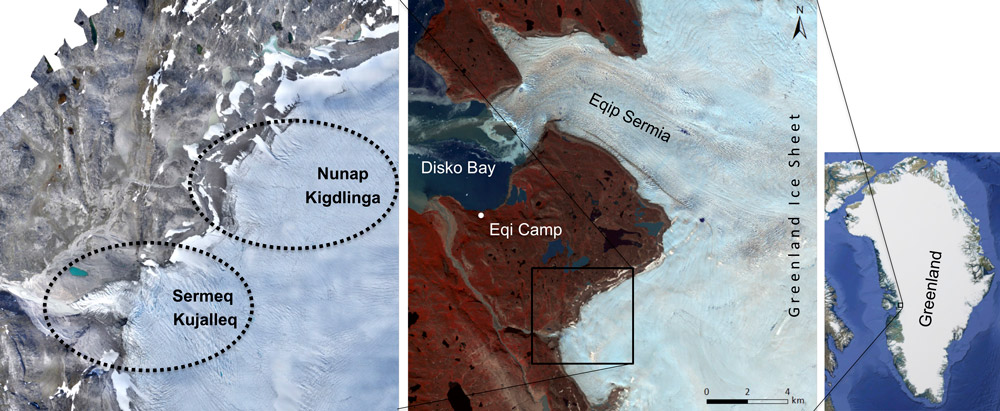
Ice sheets, i.e. the large ice-covered land bodies of Antarctica and Greenland, are well known indicators of global warming. Usually, the focus is on the fast outlet glaciers. They end in the sea and are responsible for much of the mass loss. Their changes in elevation and extent depend on air and water temperature, variations in flow velocity, but also on the topography of the glacier bed. In contrast, the land-terminating ice margins are much slower in their movement. Changes are therefore often less dramatic and correspondingly more difficult to measure. Their dynamics depend almost exclusively on the surface balance: Changes in surface elevation and ice extent are primarily dependent on air temperature and are therefore particularly good indicators of climate change. This was an important motivation to focus my master thesis on such little-observed, slow-flowing and land-based ice sheet margins. Specifically, the two adjacent ice margin areas "Nunap Kigdlinga" and "Sermeq Kujalleq", the latter forming a kind of glacier tongue at a step in the terrain.
Merging historical records with modern measurement data
How have these two sections of the ice-margin changed over the last 100 years in terms of their extent, ice thickness and flow velocity? To answer this key question, I combined a variety of different data sources: The first originates from the Swiss polar researchers Alfred De Quervain and Paul-Louis Mercanton. In 1912 they completed the second ever crossing of the Greenland ice sheet. In the course of this they also produced detailed descriptions and maps of the place on the ice sheet where they had reached the ice sheet: "Nunap Kigdlinga". On site I was able to re-measure the old reference points and thus georeference the historical maps accurately. It is these reports that represent the first record on my timeline.
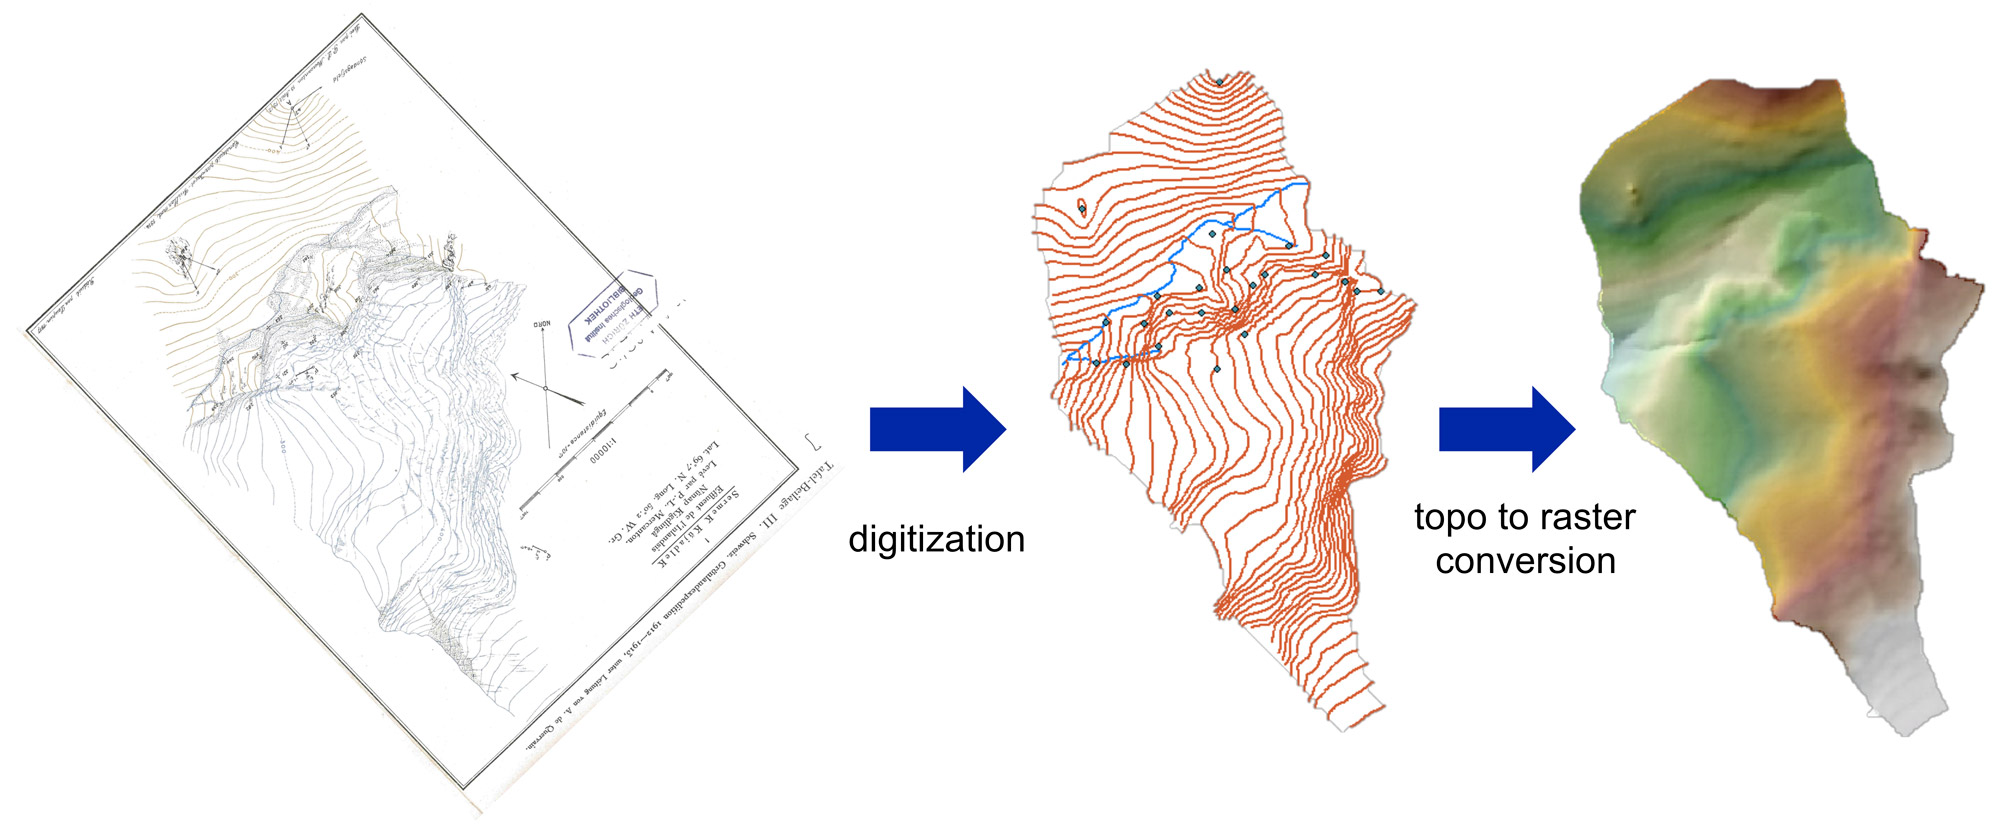
The next two-dimensional information is available from 1959 in the form of Danish aerial photographs. With the help of modern "Structure from Motion (SfM)" software, a 3D terrain model of that point in time could be calculated. With AeroDEM, the same was already available for 1985. From the year 2000 on I relied on the ever-improving satellite data. Finally, I documented the "actual state" on site with the help of a drone and then created a high-precision terrain model with a resolution of a few centimeters using "Structure from Motion" software. This unusually long-time axis allows us to trace the developments of the last hundred years.
Unprecedented ice loss since 2003
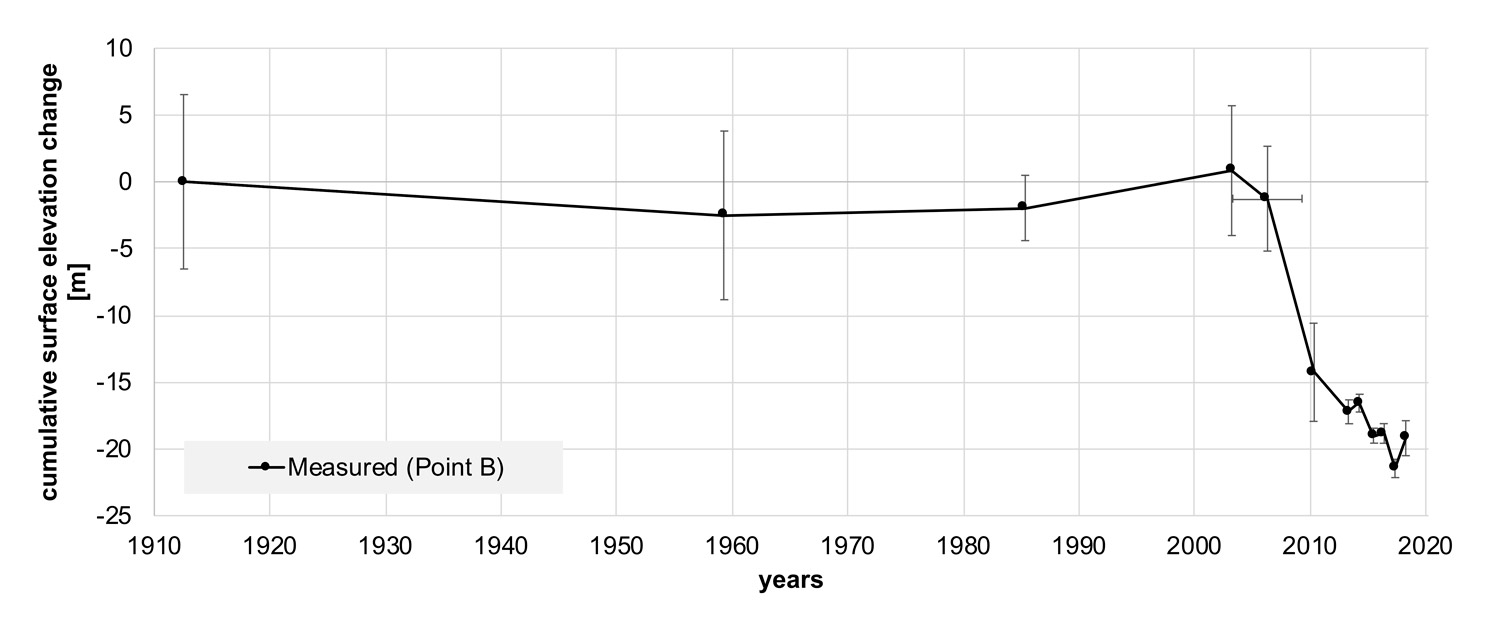
The results speak for themselves: from 1912 to around 2003, the ice thickness and extent in the study area remained remarkably stable. Only then did a massive melt set in: The ice has steadily lost surface area and thickness ever since. At the same time, the flow velocity in the area of the Sermeq Kujalleq glacier tongue slowed down.
This change is almost entirely due to surface melting and correlates strongly with the rising air temperatures observed at surrounding weather stations during this period. The current rate of ice surface elevation loss in the area under investigation is unmatched in the last hundred years. This shows how drastic today's changes are.
These findings are of great importance for understanding the dynamics of the ice sheets and their marine-terminating outlet glaciers. If one of their many influencing factors can be quantified, it makes it easier to assess the remaining ones.