Communicable Diseases and GDP
Global Relationship Analysis from 1990 to 2019


At the heart of the 2030 Agenda for Sustainable Development adopted by member countries of the United Nations in 2015 are the 17 Sustainable Development Goals. These goals call for global cooperation between countries and range from ending poverty and other deprivations to improving health and education and reducing inequality.
This project was motivated by Goal 3: Good Health and Well-Being, more specifically Target 3.3, fighting communicable diseases and epidemics like AIDS, Tuberculosis and Malaria. Goal 10: Reduced Inequalities does also come into play using GDP as an indicator for economic well-being.
Communicable diseases are some of the leading causes of death worldwide, resulting in millions of people dying every year (WHO). Particularly in low-income countries, communicable diseases are widespread and contribute to a substantial number of deaths (Baylor College of Medicine). To assess a potential relationship between communicable diseases and GDP across countries, we have created a web app designed to answer the following research questions:
To what extent does the susceptibility to deaths from communicable diseases reflect a country's economic situation?
If a relationship between the number of deaths from communicable diseases and a country's economy can be observed, how has it evolved over the past thirty years?
...caused deaths from 1990 to 2019
Three datasets were used to evaluate and analyse the relationship between economic health and deaths from communicable diseases between 1990 and 2019.
The indicator used for economic performance is the gross domestic product (GDP) per capita in US dollars, measured in constant 2010 US dollars. The GDP describes the total market value of finished goods and services generated in a country, including product taxes but excluding subsidies (OurWorldInData).
A list of the deadliest communicable diseases worldwide (WHO) was checked against the available data on causes of death (OurWorldInData) to obtain the disease deaths data.
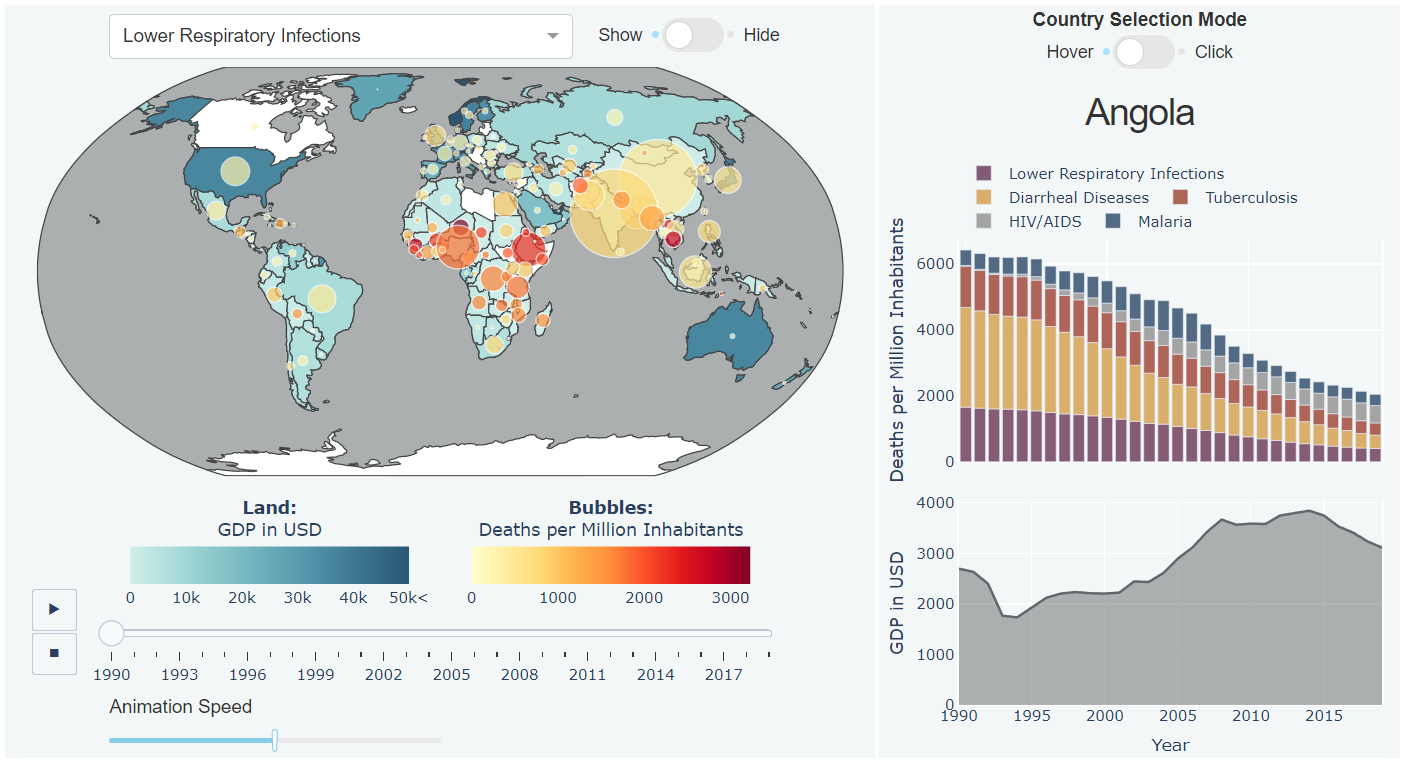
For this analysis, the scope was limited to the five communicable diseases causing the most deaths worldwide: Lower respiratory infections, diarrheal diseases, Tuberculosis, HIV/AIDS and Malaria.
To calculate the relative annual number of deaths from a disease, population figures for each country were used. Estimates are based on Gapminder data, HYDE and UN Population Division (OurWorldInData).
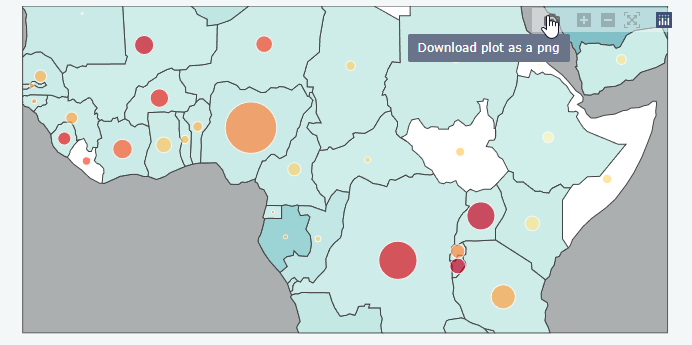
Overall, countries with lower GDPs appear to have more communicable disease caused deaths per million inhabitants than countries with higher GDPs. This can be observed in the web app by comparing the colour and size of the bubbles with the GDP of the respective country. Moreover, it can be seen that in countries with low GDP, several types of communicable diseases are responsible for substantial numbers of deaths. In contrast, in most high GDP countries, a single communicable disease (lower respiratory infections) is responsible for most of the deaths.
Looking at the time frame from 1990 to 2019 as a whole, an overall increase in GDP and a decrease in the number of deaths can be observed. However, diverging patterns can be seen for some countries.
In countries with a rather low GDP, predominantly one pattern is observed. The GDP tends to have risen strongly in these countries between 1990 and 2019, and the number of deaths has also decreased substantially for most of them. Some examples are China and Ethiopia.
For countries that already had a rather high GDP in 1990, the pattern is less clear. Although GDP has increased in most of these countries too, there are different trends in the number of communicable disease caused deaths. In some countries, such as Portugal, GDP increased but also the number of deaths has increased substantially. In other countries such as Sweden or Norway, the same pattern as in the countries with low GDP can be observed. Here, the GDP increases, and a clear downward trend in the number of deaths can be seen.