BACKGROUND
With less than 34%, Switzerland has the lowest home ownership rate in Western Europe. During the last decade, rental prices of apartments in Swiss urban areas have been rising continuously. Sparse spaces, high investment costs, and more people moving from rural to urban areas dictate the prices for apartments.
At the same time, the availability of apartments has decreased for many urban areas in Switzerland, exerting additional stress on the rental markets. The "Bundesamt für Wohnungswesen (BWO)" defines a housing shortage if less than one percent of apartments are available for rent which is the case for several of the obvserved urban areas. Our map tool provides the opportunity to interactively explore the rent cost situation in Switzerland's different urban areas during the last decade. To provide reproducible and comparable results for different regions, we implemented the Income-Rent Ratio Index.
How is the rental-cost situation changing in the largest urban areas of Switzerland and how has it developed over the last decade?
 METHODS
The data preprocessing and computation of the Income-Rent Ratio Index were performed
using R Markdown, which ensures reproducibility in the analysis. To facilitate spatial
and temporal comparisons of the index values, we selected the nine largest cities in
Switzerland based on population size.
The index represents recent values from 2020 and
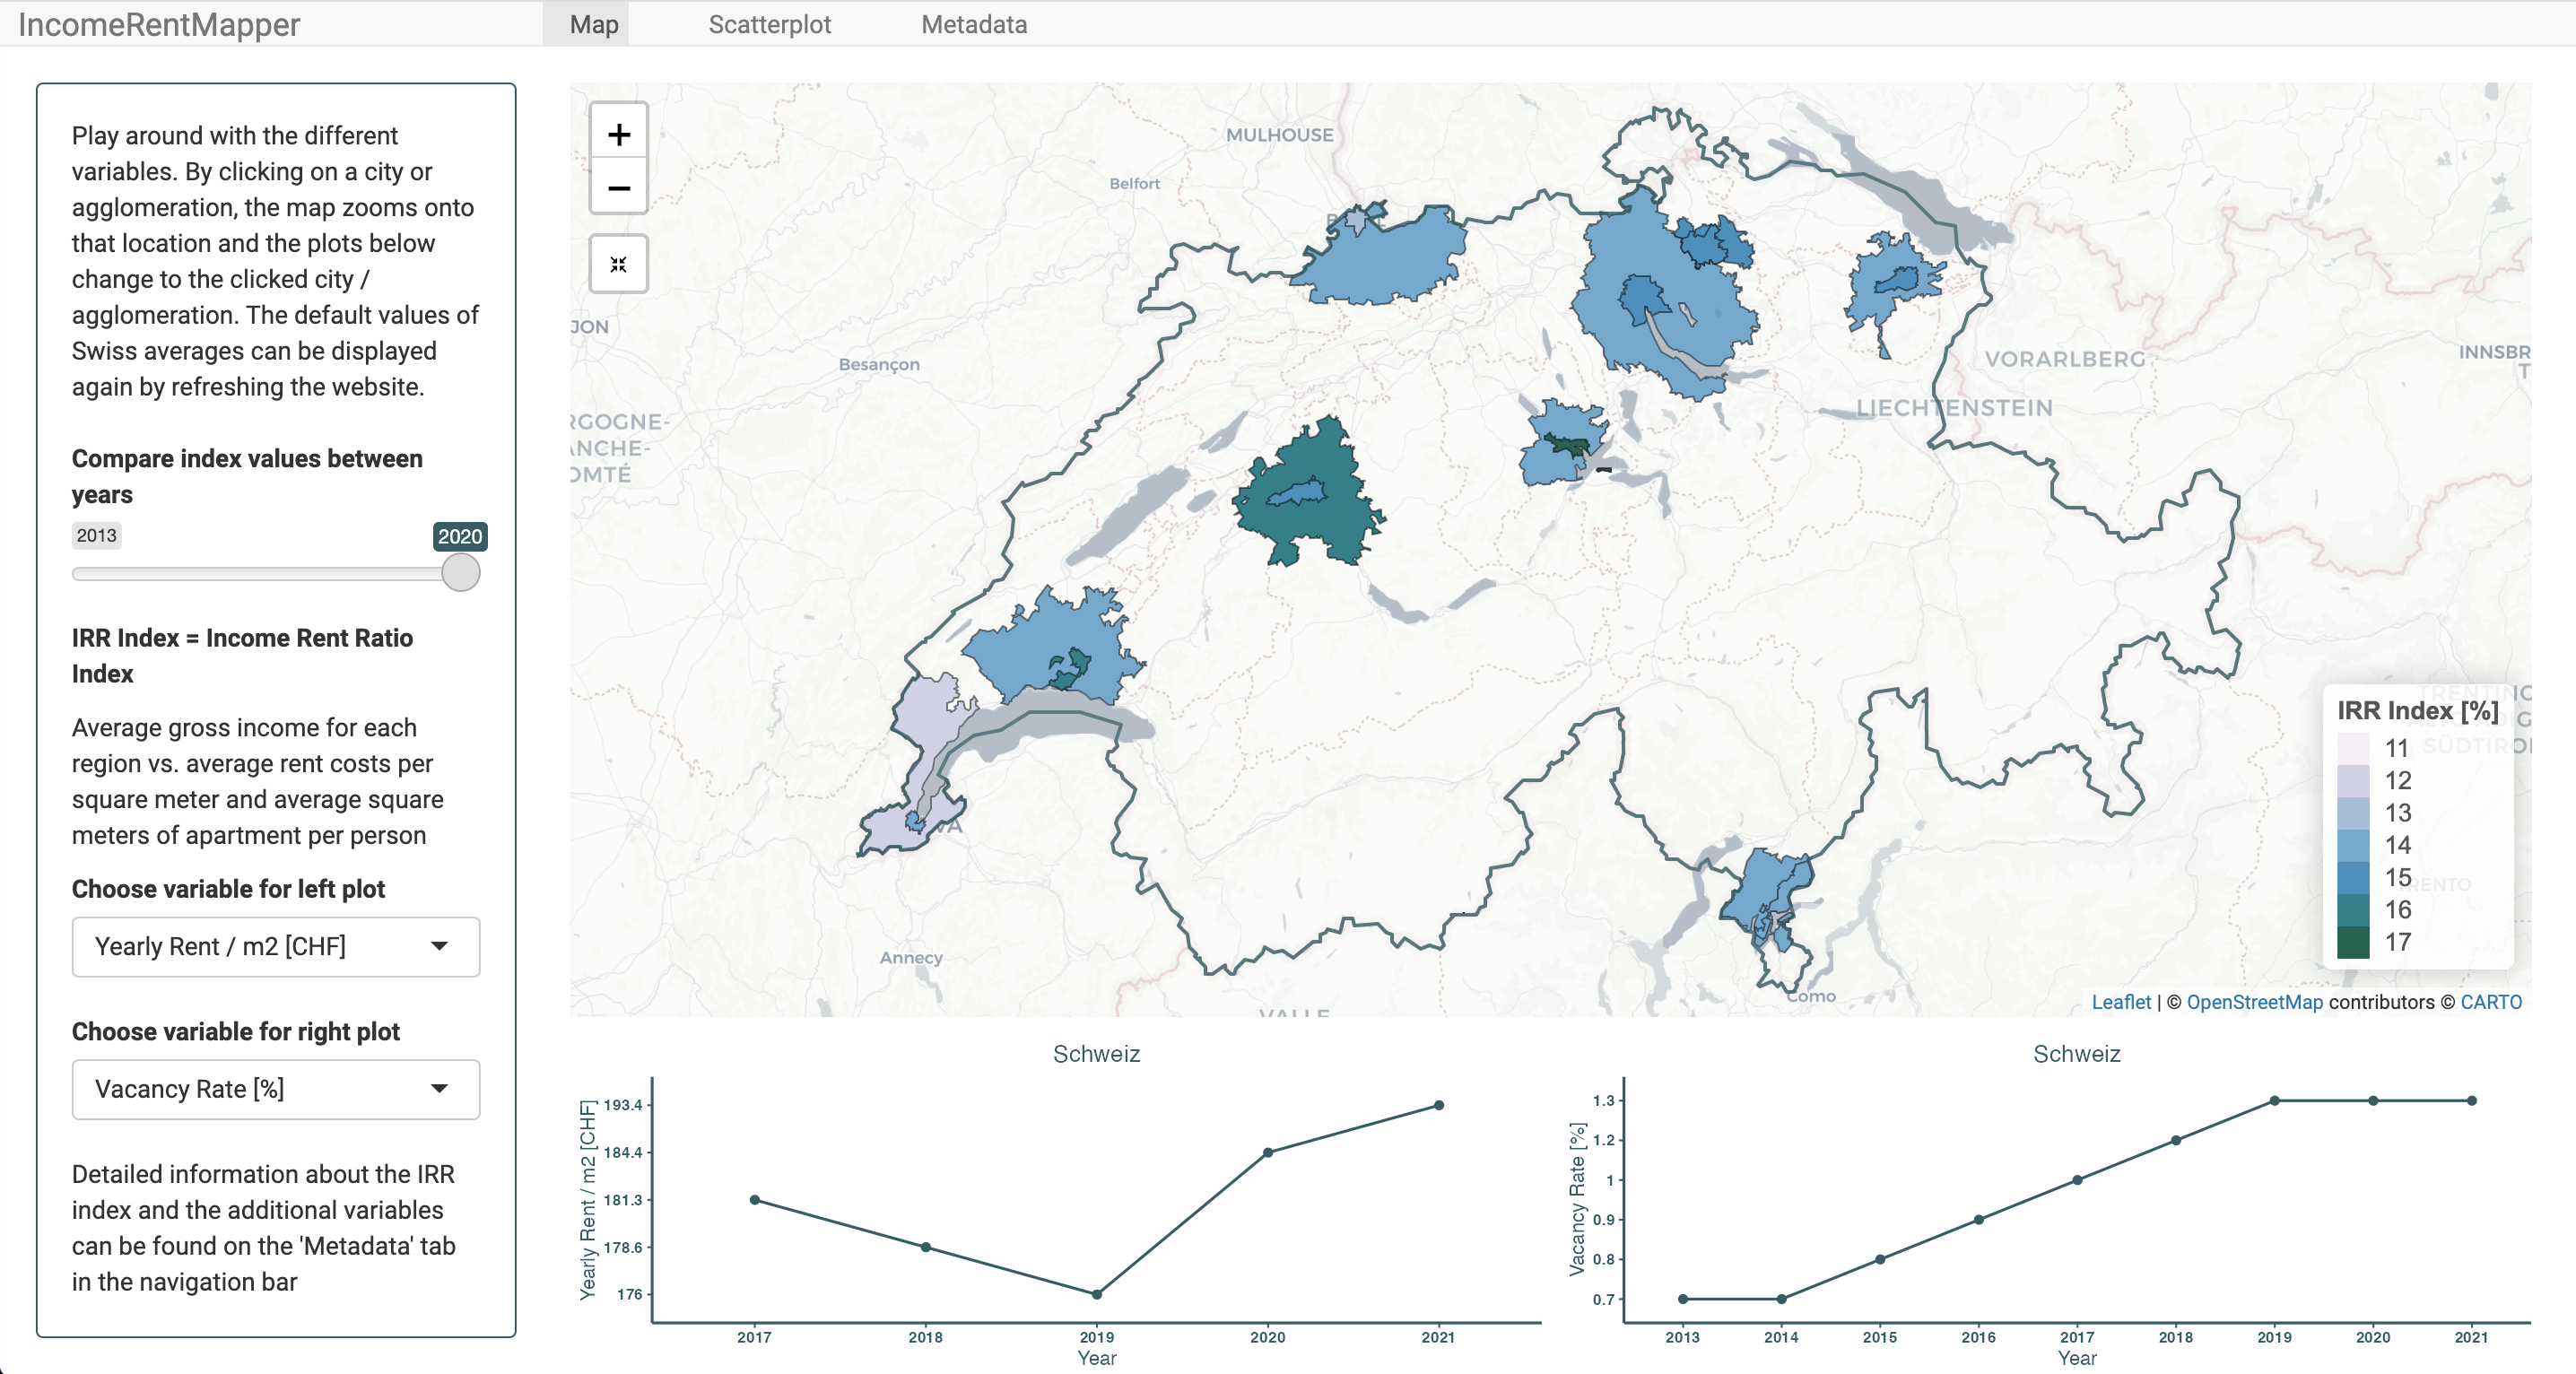
extends back to 2013. For the mapping component, we utilized R shiny to manually create
an interactive web map. This map enables users to explore the data according to their
specific needs and interests. The shiny app is seamlessly integrated into the website.
It's worth noting that the website was developed from scratch without utilizing any
pre-designed templates, ensuring a customized approach to its coding and design.
The Income-Rent Ratio Index (IRRI)
The Income-Rent Ratio Index provides a normalized comparative index between regional income and rental prices.
With the increasing costs and disparity between different urban regions the IRRI can be used to identify rent-burdened regions and detect spatial and temporal patterns of change.
To calculate the index, we use average gross income for each region, average rent costs per square meter and average square meters of apartment per person.
By doing so the number of people sharing a household and their combined income to pay rent does not have to be considered.
IRRI =
 DATA
DATA
We used various data sets from the Bundesamt für Statistik (BFS). The data sets were extracted from the STAT-TAB interactive tables. These tables provided us the necessary information for city centres and surrounding agglomeration areas.
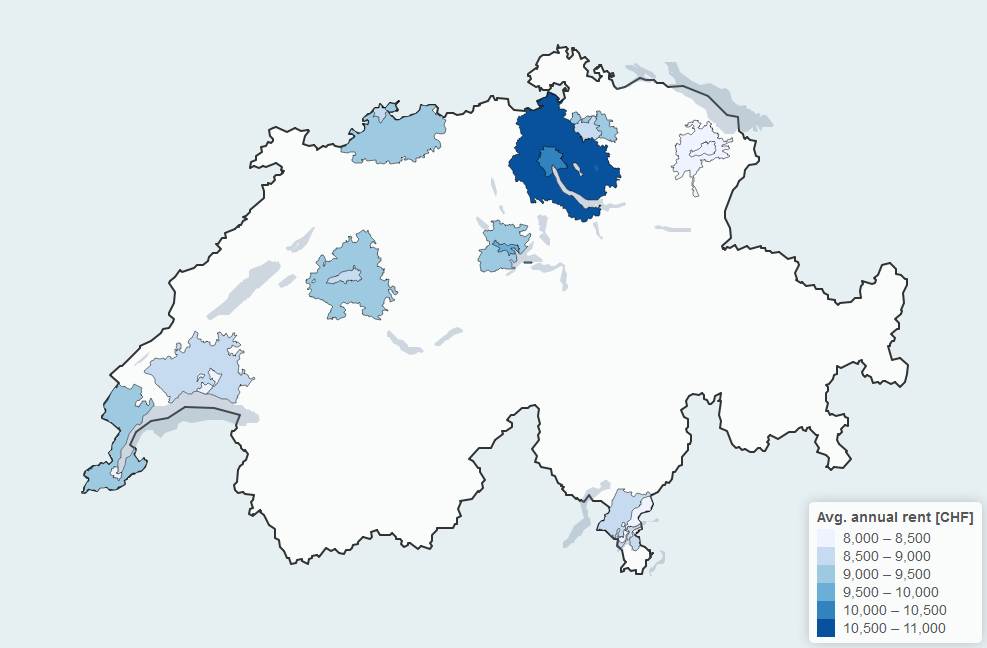
Displayed on the left is the average annual rent cost in CHF for our study areas from 2020. The annual rent is calculated from the monthly rent per square meter and multiplied with the average number of square meters available per person.
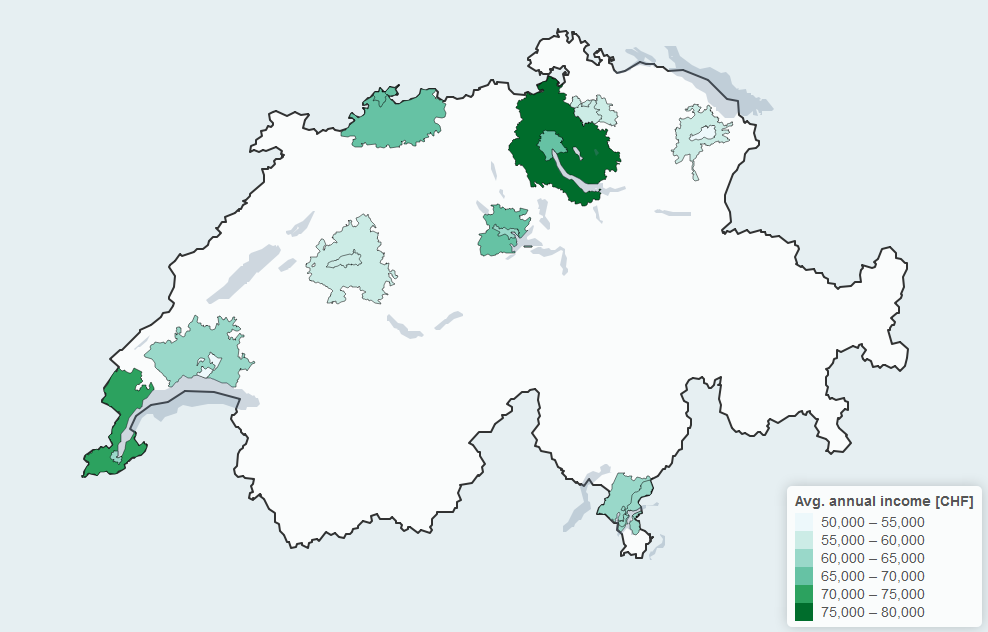
The second data set shows the annual income in CHF for the same period. The income is before deducting taxes. We already see some spatial patterns when comparing the displayed datasets.
Further data are introduced as additional information (e.g. vaccancy rates to represent the strain on the regional rental markets). The data does not discern between different socio-economic groups, but rather gives averages over the population in a given study area.
 FINDINGS
An increase in rent costs and wages can be observed for all study regions. The increases are linear, but do show different gradient steepnesses. The ratio from income to rent does not develop equally for all regions.
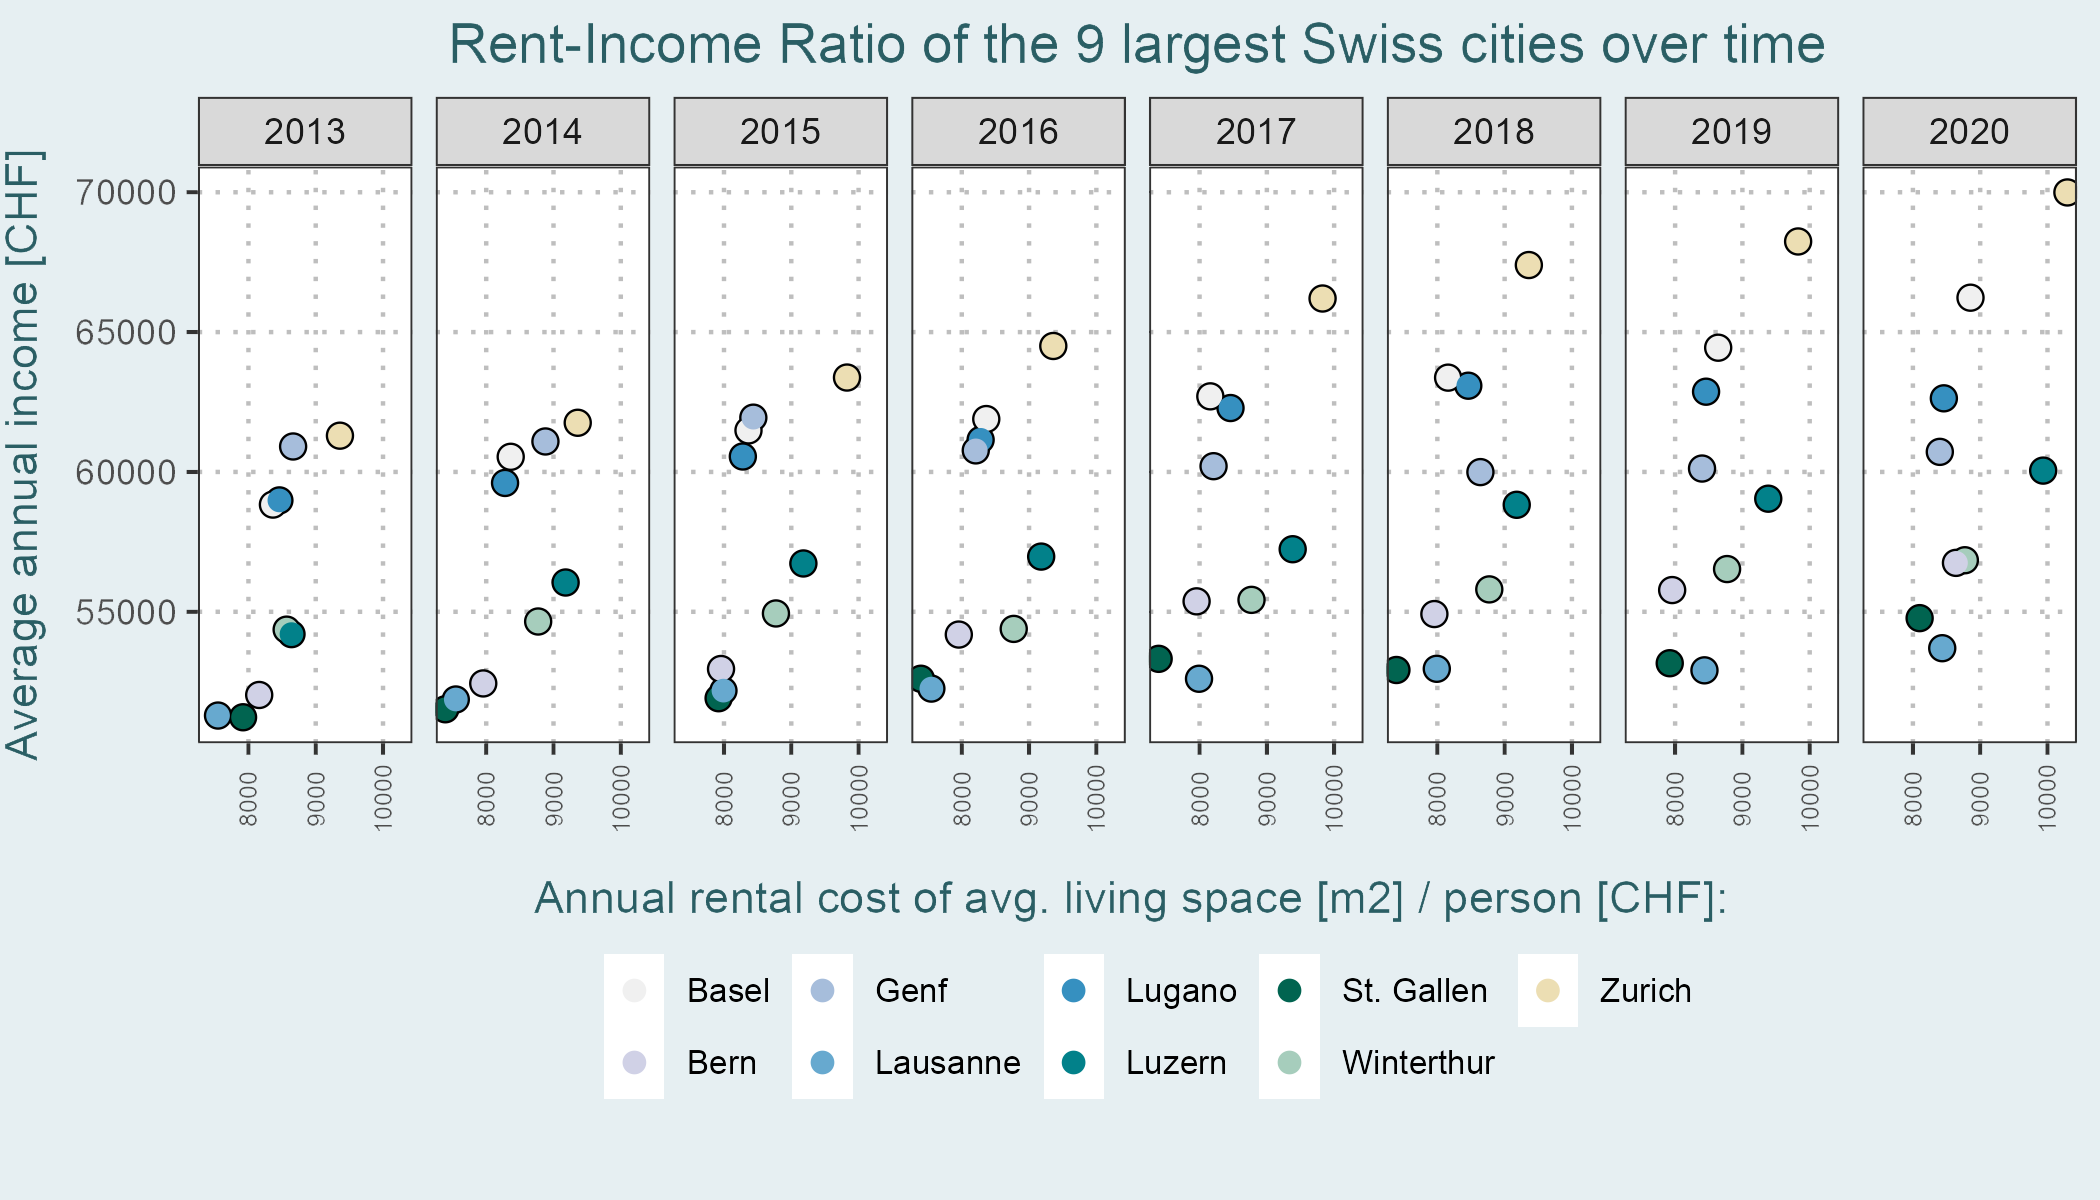
Zurich has the highest rent costs and the overall the largest percentual and absolute increase in rent cost. According to studies conducted by the City of Zurich average rent prices have increase by staggering 40% over the last two decades. However when normalized with income this increase does not seem apparent. This might be explained by correlation between regions with high income being able and willing to afford a more expensive or larger apartement. Therefore the ratio between rent costs and income is stabilized by the explained correlation.
Conceptual
When considering the data, it is important to acknowledge that only limited datasets were included in the analysis. This limitation could potentially affect the comprehensiveness and representativeness of the findings. To address this, future iterations should strive to incorporate a wider range of variables beyond income and rent datasets, as they serve as proxies to achieve a more comprehensive and nuanced understanding of the subject matter.
In terms of index computation, it is crucial to consider the approach utilized. The current method employs a simple approach that solely considers mean values. However, it is important to note that mean values can be heavily influenced by outliers and strong discrepancies within the dataset. To address the concern, utilizing the median instead would have been more appropriate, as it offers a more representative measure of the majority of the population. However, due to limitations in data availability within this context, the use of the median was not feasible.
Visualization and technical
In term of technical issues, the scalability of the web map should be considered. Currently, the map user interface remains static and does not adjust to different window sizes, nor is it optimized for mobile phone use. This limitation hinders the accessibility and usability of the map across various devices. However, the adjustment of this limitation is beyond the scope of this project.
It is worth highlighting that the manual coding of the website and map proved to be time-consuming. Although the manual approach allowed for customization, it limited the potential for enhanced formatting and user-friendliness due to its complexity. Given more time, improvements could have been made to ensure a more polished and user-friendly experience.
Contextual
Even though the IRRI portrayes how urban accretion centers have higher rental costs, many questions remain to depict a complete image of such a complex topic.
The data applied considers paid rent and not the price paid on the current market,
which is strained because some regions have less than one percent of apartments available.
This implies that the displayed data does not represent the current housing situation, but rather an overview of rent paid on average.
We expect there to be great disparity if the costs for rent on the current market are compared to our data and much more extreme rent burden for new renters.
The analysis of impact on different socio-economic groups most likely would reveal more diverging costs for rent as a function of income and would be a great follow-up research question.
The relationship between income and rent can provide initial information about rent-burdened regions. However, in order to get to the bottom of this quite complex problem, further parameters would have to be included. Key processes such as investment trends, availability of housing in different price segments, composition of the population and transit to work from other regions might influence how the rental market is evaluated. Some key processes determining the rent price or development of salary levels are difficult to quantify in a satisfyingly comparable manner.
Investors want to see high return rates on their properties and invest in apartments in the high and highest price segments, leaving a daring gap of affordable apartments in the lower price segments. The social background plays a key role too. With rising prices and less available housing in the lower and medium price segment, the less fortunate feel the harshest impact. Many rental contracts are closed before ever being advertised on the open market making access to affordable apartments exclusive for outsiders.
 ABOUT
ABOUT
To understand and implement concepts of data visualisation, the University of Zurich offers a course led by Prof. Dr. Sara Irina Fabrikant. This website and its content are the result of this course in the spring semester 2023. All the data collected was processed and visualised by our group.
Development of map visualisations and R Shiny implementation.
R implementation and website design.
Data preparation and processing, website design.
Bourassa, S. C., & Hoesli, M. (2010). Why do the Swiss rent?. The Journal of Real Estate Finance and Economics, 40, 286-309.
Schaerer, C., & Baranzini, A. (2009). Where and how do Swiss and foreigners live? Segregation in the Geneva and Zurich housing markets. Swiss Journal of sociology, 35(3), 571-592.
Stadt Zürich, 2023, URL: https://www.stadt-zuerich.ch/prd/de/index/statistik/publikationen-angebote/publikationen/webartikel/2022-11-03_Mietpreise-in-der-Stadt-Zuerich.html, accessed: 15.05.2023.
STAT-TAB, Bundesamt fuer Statistik (BFS), 2023, URL: https://www.pxweb.bfs.admin.ch/pxweb/de/, accessed: 05.05.2023.