PROJECT
Introduction & Relevance
SUSTAINABLE DEVELOPMENT GOALS
Back in 2015, several world leaders agreed to the 17 Sustainable Development Goals (SDG) as successors of the millennium Development Goals. These goals act as a guideline for governments, businesses, civil societies and the general public to create a better and more sustainable world by 2030. In total there are 17 main goals, which consist of 169 different targets, which include the people of planet Earth and its flora and fauna 1.
Our project focuses on SDG 11 – Sustainable Cities and Communities:
The goal of SDG 11 is to make cities and human settlements inclusive, safe, resilient and sustainable. More precisely we want to look at Target 11.2 as noted in the box.
Target 11.1
By 2030, provide access to safe, affordable, accessible and sustainable transport systems for all, improving road safety, notably by expanding public transport, with special attention to the needs of those in vulnerable situations, women, children, persons with disabilities and older persons 2.
COVID-19 PANDEMIC AND MOBILITY IN URBAN AREAS
COVID-19 has swept across the globe in a matter of months. Urban areas were severely affected, as over 90% of COVID-19 cases are registered in urban areas. Regulations such as lockdowns and home-office obligations were introduced, to reduce the pace of the spreading virus. Such regulations had a profound effect on the amount and mode of mobility overall.
Research conducted in Budapest shows a general reduction in mobility after the introduction of measures against the spreading of the virus. Whereas public transport experienced the greatest reduction in demand, cycling saw the lowest decrease 3.
Figure 1 visualises the daily distance travelled by different modes of transport over time in Switzerland. The distance travelled by bicycle even increased rapidly after the first lockdown in March 2020. The change in daily distance for bicycles is negative over the winter months. But it increased again for spring 2021 4.
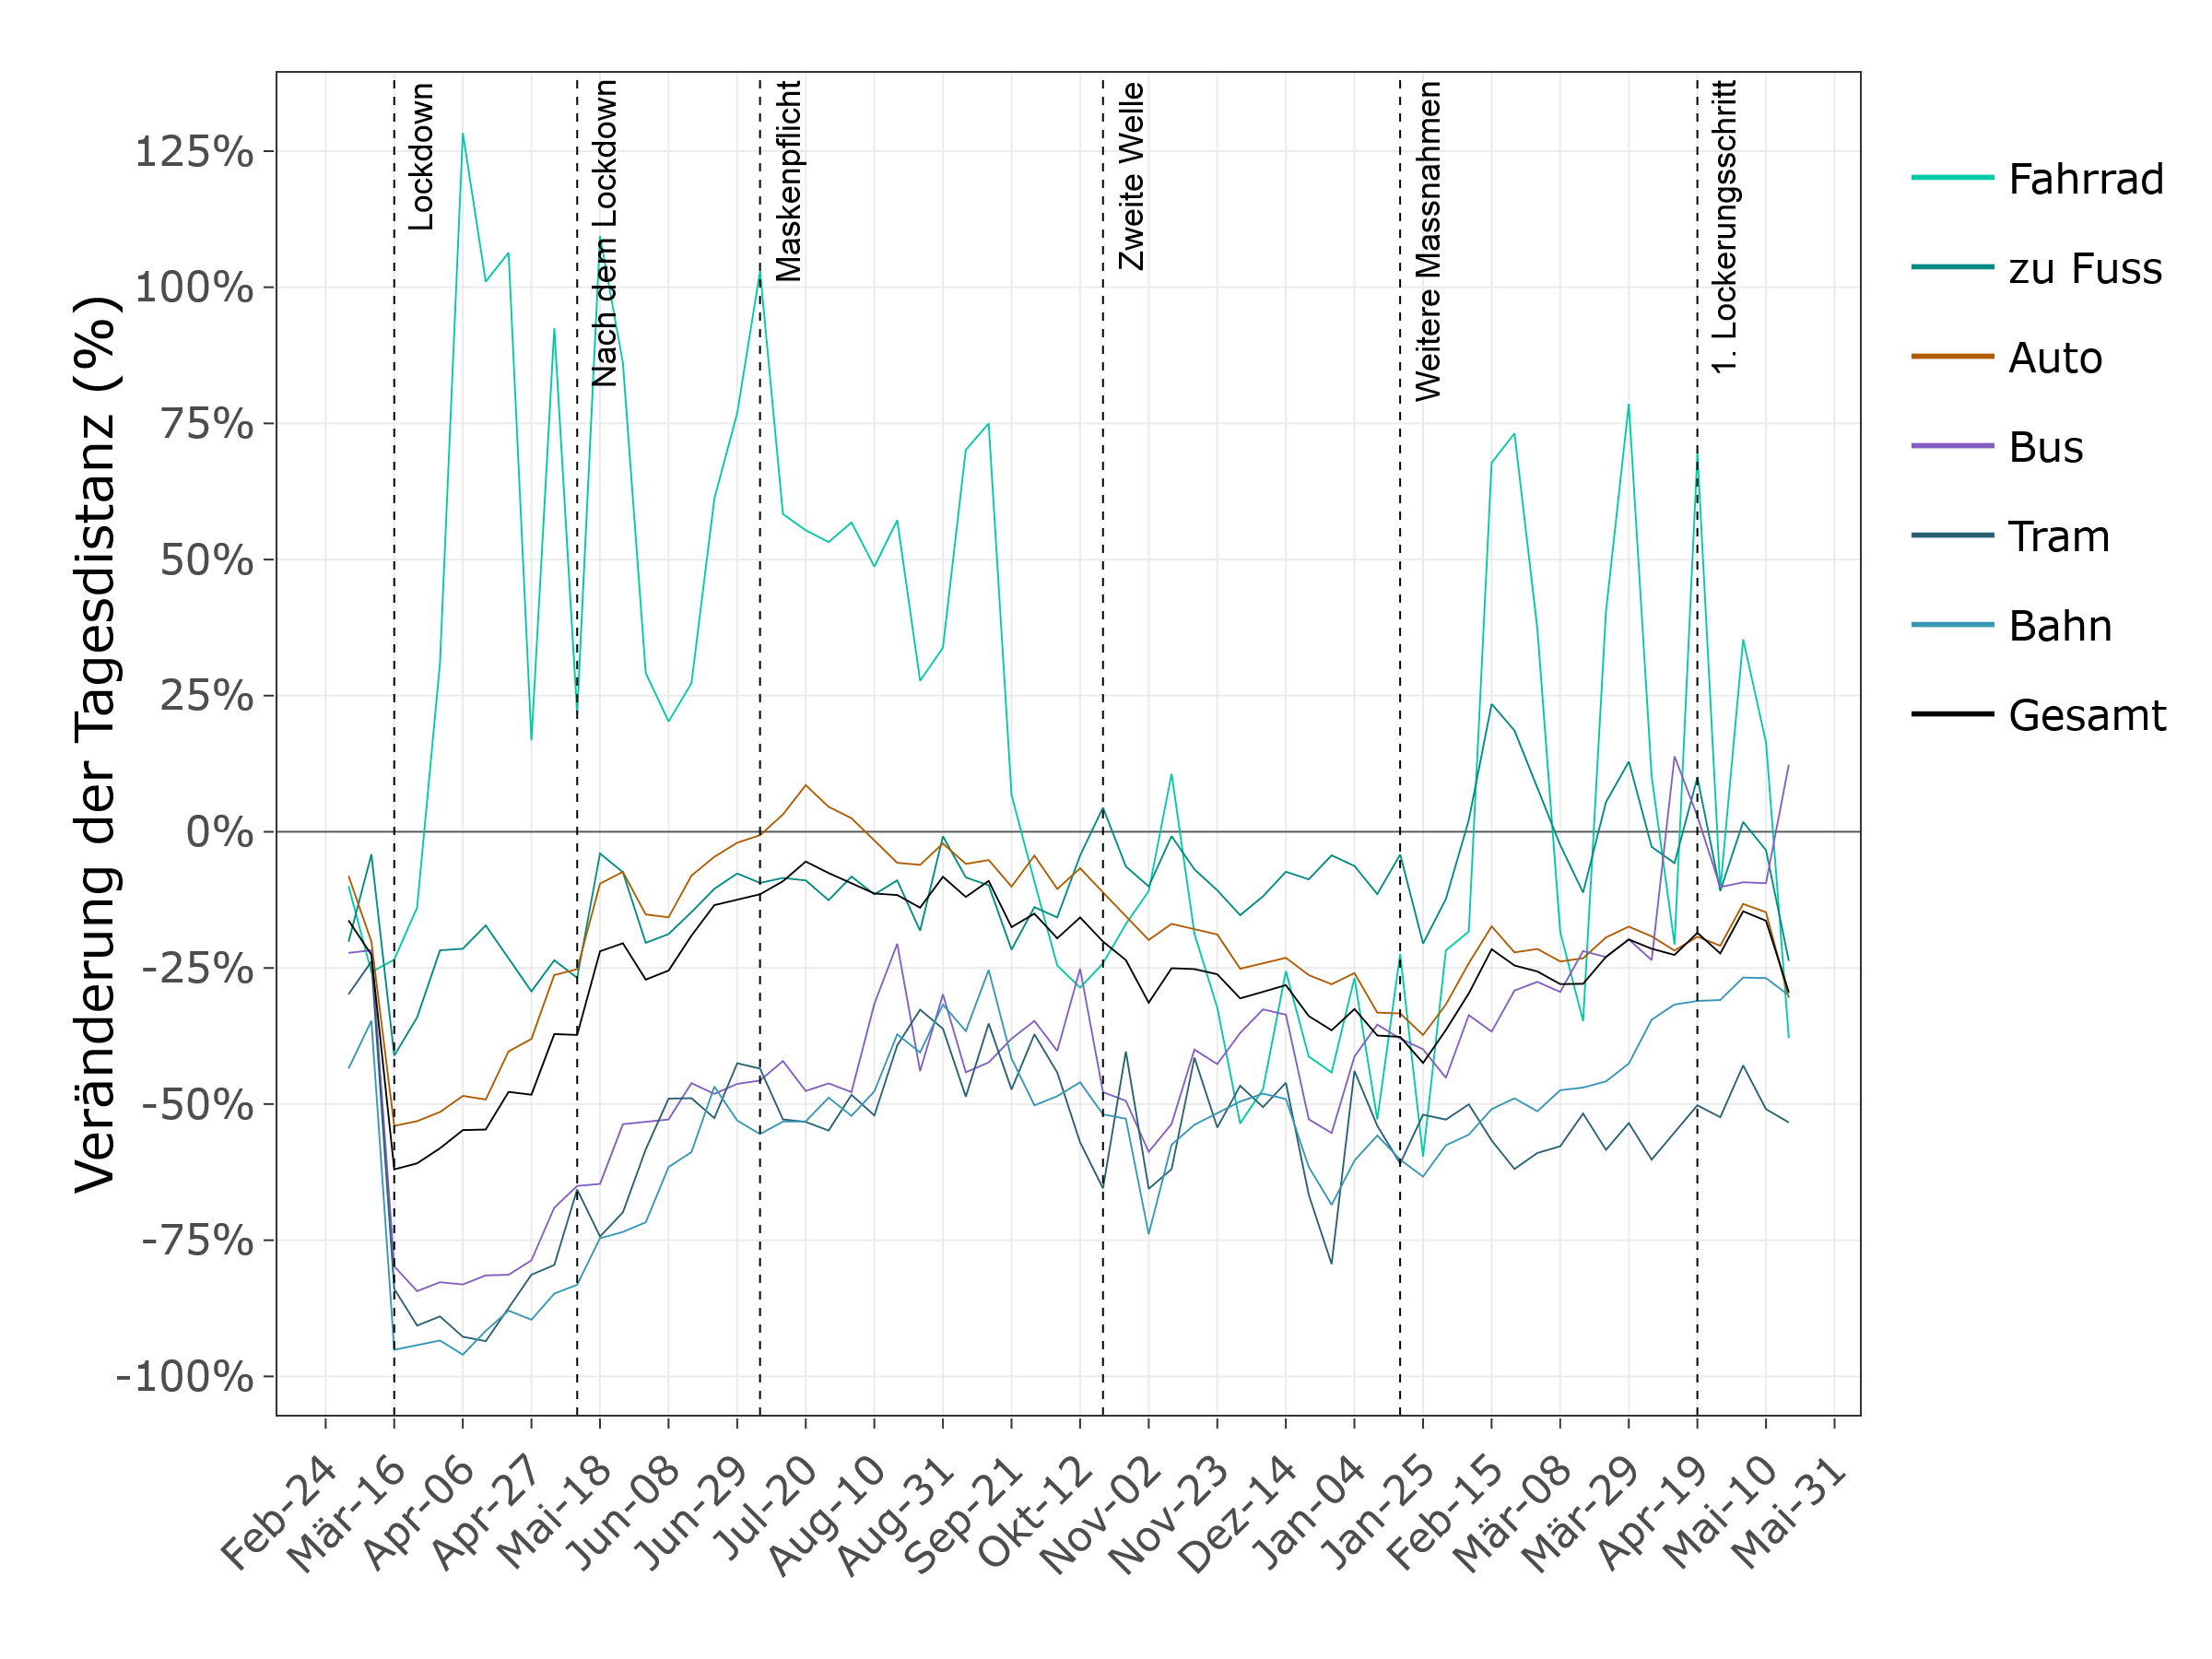
FIGURE 1: Mobilitätsverhalten in der Schweiz
SHARED MICROMOBILITY
Urban areas around the world struggle with traffic congestion, air pollution, noise and traffic accidents. According to the «Global Traffic Scorecard» people in Zurich loose 156 hours per year in congestions 5. Therefore bicycles, public transport and walking are popular alternatives for getting around in urban areas. In recent years, more and more shared micromobility (SMM) services have emerged in Zurich. These include shared (e)-bikes and e-scooters. 65% of commuters use public transport as their main mode of transport 6. For trips to and from the station shared micromobility services are often used in conjunction with public transport 7.
Hypothesis
Such observations led us state the following hypothesis: Despite the overall decrease of mobility during the lockdowns in 2020 3,4, we expect a lesser decrease or increase in the use of shared micromobility (SMM), due to a general aversion towards the usage of conventional public-transport.
SMM can act as a safe alternative to conventional public transport. This might be a possibility to decrease the pace of a spreading virus. Environmentally conscious people that were first-time-users during the pandemic might choose SMM over cars or public transport in the future. This would lead to less pollution and congestion in cities through the accelerated adoption of less polluting modes of transport. SMM could therefore act as an integral component in the achievement of SDG Target 11.2.
MAP ANIMATION
Several studies 8,9,10 have been deducted to better understand the factors involved in readability and comprehensibility of animated maps. The main point of interest lies in how spatial and temporal change is detected by map users.
As we animate a change over time, we try to apply the knowledge gained in the mentioned studies. The map has a setting to either view the data as a choropleth map or change to graduated symbols. To some degree this is preference based, thus we include both options to let the user switch between options. As default graduated symbols and weekly data are set.
As we animate spatio-temporal data we investigate visualisation methods suggested by the literature (see methodological research question).
Research Questions
RQ1: Did the Pandemic have an influence on the modal-share in favour of two-wheeled shared-mobility (E-scooters and Bikes) in the City of Zurich?
RQ2: How did the modal share of SMM temporally vary between different districts in the City of Zurich?
RQ3: Which animation style and data generalisation is most effective for detecting and understanding spatio-temporal patterns?
Workflow
Public transport data for the City of Zurich was downloaded from VBZ 11. Tier Scooter and PubliBike data represent the modal share of SMM. Roland Schmid from the Networked Systems Group at ETHZ provided us with the access to a SMM database, where the Networked Systems Group saved results from the public Swiss shared mobility platform18. Specific PSQL queries were used to download the relevant data from the database. A mask was programmed in Python to reduce all entries of one trip to one point representing the last location of the whole trip. The data gets sorted by scooter or bike ID and time. Movement within a certain spatial threshold over time did not count as a trip. This threshold was implemented to reduce GPS inaccuracies. The mask applies TRUE and FALSE values to each entry. This enabled us to get the end of trip entries. All end of trip points were aggregated per Stadtkreis and Date in QGIS and the modal share was calculated. Specifically, as two ZHAW studies from 20196 and 202012 showed, Tier makes up a third of all E-Scooter vendors in Zurich, while PubliBike accounts for the vast majority of bikes. Then the data is corrected for the market share of the platforms. The visualisation of the data was done in RStudio and R Shiny.
FIGURE 2: Our Data and Workflow
RESULTS
RQ1: Did the pandemic have an influence on the modal-share of shared micro-mobility and public transport in favour of shared-mobility (E-scooters and (E)-Bikes) in the City of Zurich?
The pandemic did have an influence on the modal-share of SMM and public transport. But the modal share of SMM did decrease from 2019 to 2020. This is clearly visible in the plot below the map. The COVID-19 pandemic led to a drastic reduction in the weekend modal share of SMM. Possible reasons for this pattern are manifold. On one hand less commuters travel on weekends. This would suggest that more commuters use public transport than SMM. A possible explanation for the weaker difference between weekday and weekend modal share of SMM in 2020 could be the cease of a dominant user group during the pandemic. Reck and Axhausen suggest that SMM users tend to be young, university-educated males with full-time employment13. Out-of-home travel activities were reduced to necessary trips only. In the Kelowna region of British Columbia, Canada out-of-home activities were reduced by more than 50% during COVID-19. High daily frequency of travel was only found for routine shopping, followed by work-related travel14. This could also explain the lower reduction of the modal share of SMM during weekdays. The lack of late-night activities during the pandemic could also explain the reduction of the weekend modal share of SMM, as this mode of transport enables mobility during night-time, where public transport services are less frequent15.
RQ2: How did the modal share of SMM temporally vary between different districts in the City of Zurich?
In May 2019 the highest percentage of weekly SMM modal share can be found in district 6. The more central districts of 1, 2, 4, 5, 6 and 8 have the highest values of weekly SMM modal shares during the summertime. The peak is around July 2019, where most districts have a 10-20% modal share occupied by SMM. District 12 has a constant low weekly SMM modal share until 07.07.19. The modal share in all districts decreases steadily towards the winter months. Some variations in the low percentages can be found in district 3, 4, 5, 6 and 9. District 4 has in comparison to other districts a larger weekly SMM modal share until late October/early November 2019. District 8 has the highest weekly SMM modal share during the COVID-19 affected summer of 2020. This could be due to the proximity of Lake Zurich and recreational areas. The weekly modal share of SMM in district 1 is much smaller in 2020 compared to 2019. This could be explained by the missing user group as mentioned in 14.
RQ3: Which animation style and data generalisation is most effective for detecting and understanding spatio-temporal patterns?
We conclude that graduated symbols are better suited to visualise the change in modal share of SMM in an animated map. The visual variables size and colour hue both represent the modal share of SMM. The most effective and efficient visual variables colour hue and size were used in combination to possibly minimise change blindness16. We think that choropleths in our animated map are more prone to change blindness, as only colour hue helps to detect changes between different time frames. Dependent on previous map reading experiences, the use of two visual variables representing the change of the same value can lead to confusion.
Although our data has a daily temporal resolution, we suggest the user to investigate the generalized data on a weekly timeframe, by setting the default data frequency to weekly. This serves two purposes. First, mobility fluctuates during the span of a week. People are usually much more out and about with SMM during the weekend compared to a workday. This complicates the cognitive knowledge aggregation over a bigger time span. Secondly, the generalisation of data has been suggested by research (Cybulski et al, 2021)8, to enhance the comprehensibility of the displayed data and lessen the role of change-blindness.
The animation speed of our map can be manipulated using the drop-down selector. The manual use of the time slider enables the view of individual time frames. Automatic animation helps to examine trends in patterns. User-controlled animations are more useful, when focusing on details within a pattern17. Our map needs to be tested for change blindness in experiments as conducted by Cybulski et al. (2021), Fish et al. (2011) or Goldsberry et at. (2009)8,9,10. Such experiments can deliver quantifiable answers to the assumptions/personal experience stated in this section.
MISSING DATA
With the first lockdown in place many SMM providers stopped their service18. The collected data we use was also affected by the measurements as our data has missing entries between march and may. Tier did shutdown its services whereas Publibike did not. Because our Data is completely missing for some days, we suspect that also a data scrapping issue is in play.
SOURCES
Literature
1 United Nations SDG's
https://unstats.un.org/sdgs/report/2020/goal-11/ | Access 07.04.2021
2 Sustainable Transport and COVID-19: Response and Recovery (2020)
https://sdgs.un.org/sites/default/files/documents/26933Webinar_summary.pdf | Access 15.03.2021
3 Bucksy P. (2020), Modal share changes due to COVID-19: The case of Budapest
https://www.sciencedirect.com/science/article/pii/S259019822030052X | Access 10.05.2021
4 Mobilitätsverhalten in der Schweiz - Coronavirus-Studie (2021)
https://ivtmobis.ethz.ch/mobis/covid19/reports/latest_de | Access 07.04.2021
5 Tagesanzeiger (2019), So schneidet Zürich im internationalen Stau-Ranking ab
https://www.tagesanzeiger.ch/leben-auto/soschneiden-schweizer-staedte-im-internationalen-stauranking-ab/story/19159111 | Access 28.05.2021
6 Auf der Maur et al. (2019): Shared MobilityKollaborative Mobilitätsservices europäischer Städte im Vergleich
https://www.zhaw.ch/storage/hochschule/medien/news/2020/Shared-Mobility-2019-Studie_DE_14012020.pdf
7 Hrobjartsson S. (2019), Analysis and Modeling of Urban Shared-Mobility Systems through Data Mining
8 Cybulski, P. and Krassanakis, V (2021), The Role of the Magnitude of Change in Detecting Fixed Enumeration Units on Dynamic Choropleth Maps, The Cartographic Journal
9 Fish, C., Goldsberry, K., and Battersby S. (2011), Change Blindness in Animated Choropleth Maps: An Empirical Study. Cartography and Geographic Information Science, vol. 38, no. 4: 350-362.
10 Goldsberry, K. & Battersby, S. (2009). Issues of Change Detection in Animated Choropleth Maps. Cartographica. 44. 201-215
12 Kraft et al. (2020), Shared MicromobilityKollaborative Mobilitätsservices europäischer Städte im Vergleich, Winterth
13 Reck D. J. & Axhausen K. W. (2021): Who uses shared micro-mobility services? Empirical evidence from Zurich, Switzerland
14 Fatmi M. R. (2020), COVID-19 impact on urban mobility
15 Shared Mobility and the Transformation of Public Transport (2016)
16 Garlandini S. & Fabrikant S. I. (2009), Evaluating the Effectiveness and Efficiency of Visual Variables
17 Slocum T. et al. (2004), A Qualitative Evaluation of MapTime, A Program For Exploring Spatiotemporal Point Data
18 nau.ch (2020), Velo- und E-Trottinett-Verleiher bereiten sich auf Lockerungen vor.
httos://www.nau.ch/new/schweiz/velo-und-e-trottinett-verleiher-bereiten-sich-auch-lockerungen-vor-65704598 | Access 28.05.2021
Data Sources
11 Fahrgastzahlen VBZ
https://data.stadt-zuerich.ch/dataset/vbz_fahrgastzahlen_ogd | Access 10.04.2021
Publibike & Tier Data
18 Shared Mobility Switzerland
https://opendata.swiss/en/showcase/sharedmobility-ch collected by Networked Systems Group, ETHZ
Images
Titleimage
http://www.moonshotio.com/tag/mobility/ | Access 25.05.2021
Figure 1
Mobilitätsverhalten in der Schweiz - Coronavirus-Studie (2021)
https://ivtmobis.ethz.ch/mobis/covid19/reports/latest_de | Access 07.04.2021
Figure 2
Our Data and Workflow - Produced by ourselves using open flaticon icons
Website
The Website is programmed by ourselves, with some inspiration and snippets from W3-Schools.