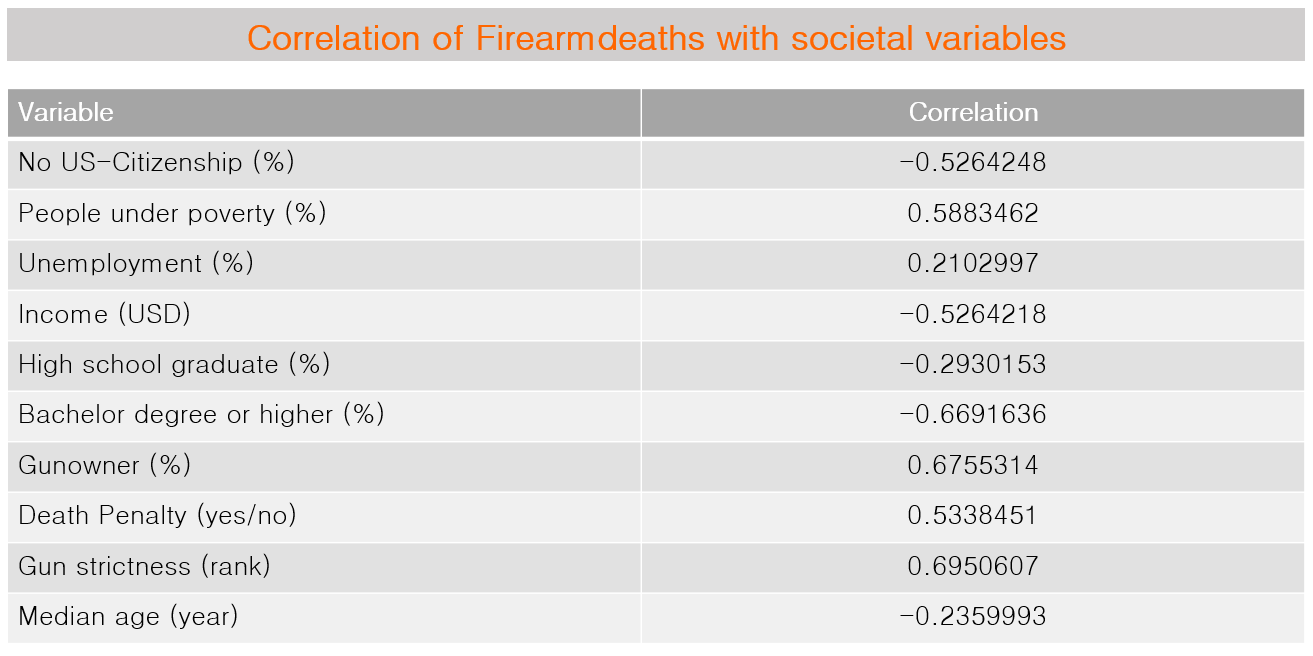
The 10 societal factors we chose for the statistical analysis show varying degrees of relation to the firearm mortality. In simple terms of the direction of this relation, i.e. does a factor increase or decrease firearm mortality. We calculated this using the Pearson and Spearman correlation indicator. Per the correlation results (Table 1):
The factors which decrease firearm mortality are:
- Higher percentage of non-US citizens in a state.
- Higher state median household income.
- Higher percentage of university educated persons in the population.
- Higher percentage of high school graduates in the population.
- Higher population median age.
Conversely, the factors which increase firearm mortality are:
- Higher percentage of gun owners in a state.
- Higher percentage of population below the poverty line.
- Higher unemployment rates among the work-age population.
- The use of the death penalty in the state.
- Laxer firearm regulation (gun strictness) in a state
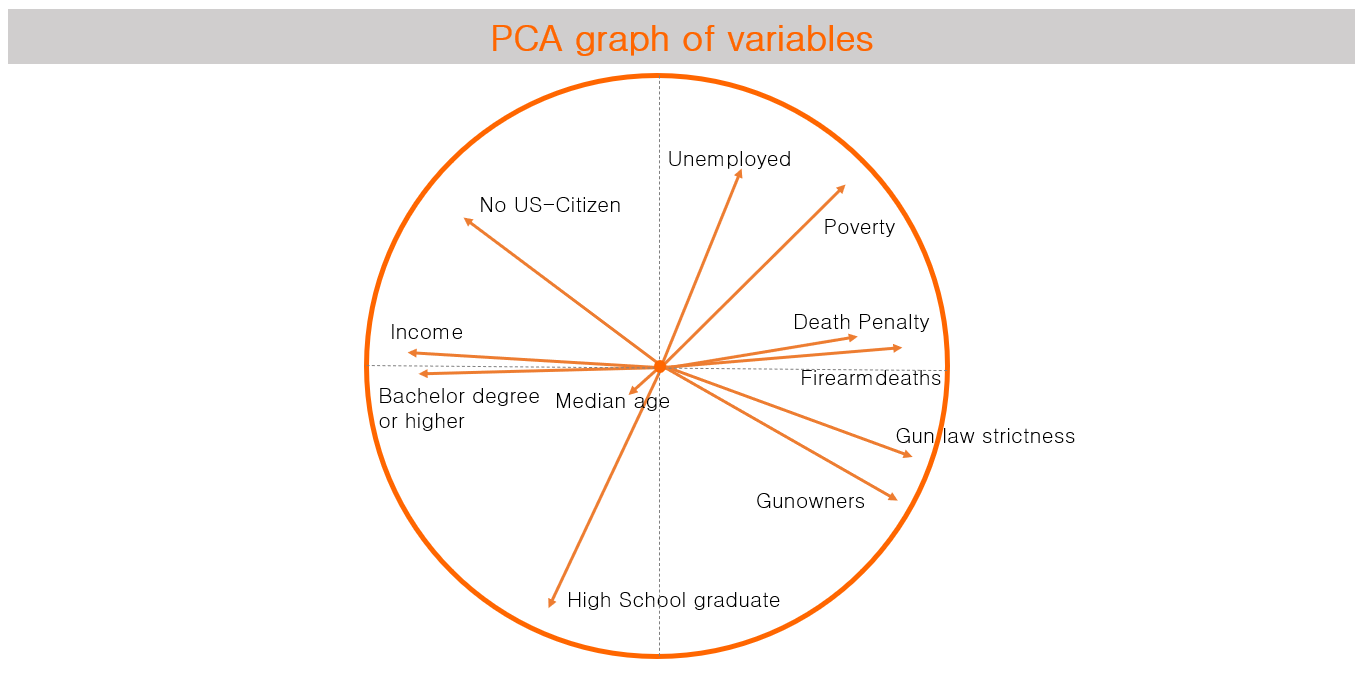
One can easily conjecture that many of these factors correlate with each other (e.g. median income and poverty, or educational attainment). To get a better overview over these relations we conducted a Principal Component Analysis (Figure 1 PCA Graph). We can see that the societal factors are not concentrated in the same quadrants of the graph. However, we can see that the positively correlated factors are on the opposite side of the graph as compared to the negatively correlated factors.
Conclusion:
As for the factors themselves, our intention was not to delve deep into the statistics of the problem but to provide a cursory view and compile a dataset which can be used for further inquiry on the topic. However, we argue that populations which have more to lose in terms of material attainment (e.g. higher household incomes, older age, higher education, non-natives) are less likely to engage in behaviours and circumstances which incur firearm related casualties. If this assumptions is correct, and we hope this might be ascertained one day, then the solution to the Worlds firearm mortality per the UN goal is simply a broad increase in wealth, quality of life, and level of education.
Webmap of the USA
In the following interactive map, we display the societal factors and their relationship with gun violence in the USA. In order to investigate on the different relationship you can switch between the different tabs. To get deeper information on a specific state you can click on it and will receive the values of all investigated societal factors on one glance.
Dashboard
To help our users better understand the data we used, we provide a interactive R Shiny based data explorer. On the Data Explorer dashboard, there are parts.
1. The Data Explorer, where you can view the datasets we used, plot the various variables in them, and see the summary statistics.
2. The Data Downloader, where you can download the data we used straight from the Shiny Server.
3. The Data Source and Information part, where we provide cursory description of the datas used, as well as the sources for each.
To access the different parts of the dashboard, click on the appropriate side (Below the title: "Group 10 Data", and top panes (e.g. Data/Plot in Data explorer)