Spread
Our data set of COVID-19 cases starts at the 21. of January 2020. As you can see in the map the COVID-19
from this day on, the virus was infecting more and more people in China, especially in the city of
Wuhan. At this time the spread was very locally and only Thailand, Korea and Taiwan had some confirmed
cases. From this time on the cases were raising exponentially in China, while in the surrounding
countries the cases only raised slowly.
On the 31st of January the first two cases are reported in Italy, which is the origin of the spread in
Europe. Until the end of February the increase of confirmed cases was just very slow but because of the
exponential growth, with every infection step more people got sick. Interestingly, Italy and surrounding
countries of China have a similar increase of confirmed cases. We can also see, that the number of dead
and recovered people lags around two to three weeks because of the infection period. During March, China
had by far the most cases, whereas it was closely followed by Italy, Iran and Korea. All other countries
do not have reported any cases or just a few until then. It is interesting to see, that during the same
time the number of recovered people in Iran is much bigger than in Italy, wherefore in Italy it was not
until the end of March, that people started to recover. From that point we got a lot of infections in
Italy and COVID-19 and spread real quick in whole Europe and finally also got to the United States. At
the time where the big wave of infections started in Europe and in the US, China has had almost no more
new confirmed cases and most of them already were recovering. Further, the surrounding countries of
China always had a small increase of confirmed cases. Comparing the spread of the virus in Europe and
the US with the spread of most Asian countries, major discrepancies can be detected. While the spread in
Europe and the US was fast and fatal, the spread in surrounding countries of China was almost
neglectable. This could be explained by the fact, that Europe and the US have a good health system, and
more tests are available and cases are reported more reliable to the public.
Million Cases
Until the 13th of March the confirmed cases per million inhabitants stay between 0-319 cases. Because
Iceland has a very small population and people got infected early, it is the country, which has the
highest number of cases per million people followed by Italy in March. Many western countries have
because of the high number of infections and the small number of the population a very high number of
cases per million inhabitants. Iran is the first country, which follows the trend of the European
countries but interestingly China has still a very small number. The number rises in North America and
then also the cases per million in South America rises, whereas the number in the whole asian and
african region is very small because of the amount of people living there. In the end of the measuring
period, we can see that Europe and North America have a very high number of cases per million, where
else in the world the number stays under 319 cases per million inhabitants and even in China with over
80’000 cases stays in the lowest category.
Mortality Index
Looking at the choropleth map displaying the Mortality index as well as on the plot showing the top 20
countries with the highest mortality index, we can see that the index is especially high in Spain,
Belgium, Italy, the United Kingdom and France. The Index seems to be generally high in european
countries and in North America. Countries such as Iceland, Russia, Australia, most countries in Africa
and Asia have a low Mortality index. By looking at the choropleth map, displaying the Median age of the
countries we can see that Spain, Portugal, Italy, Germany, Greece and Japan have the highest median age
with over 44 years. In general, the median age is high with values between 40 and 44 in Europe and
Canada. In Russia, China, Australia, the United States and Iceland, the median age is between 35 and 40.
The lowest life expectancy can be found in Africa with a median age of 30 or lower. The life expectancy
seems to be distributed likewise.
It is interesting to see that at least some of the countries with a high mortality index, also have a
median age and life expectancy that is comparably high. This is the case for countries such as Belgium,
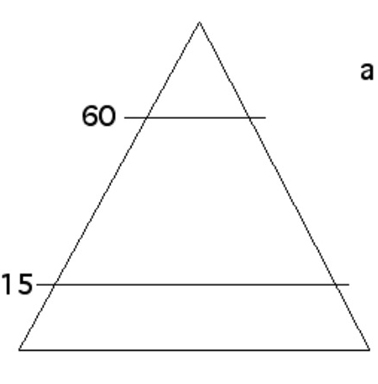
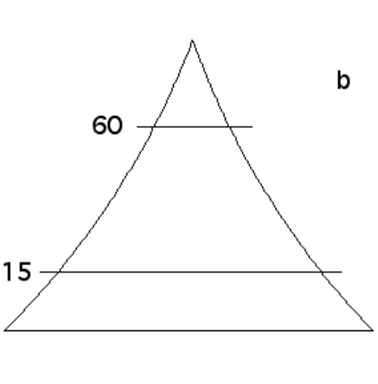
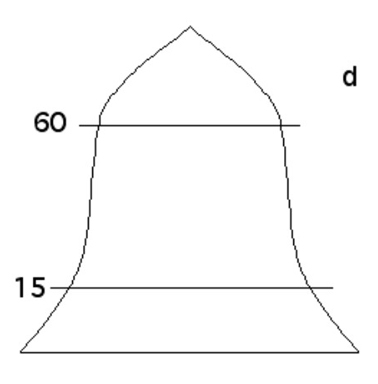
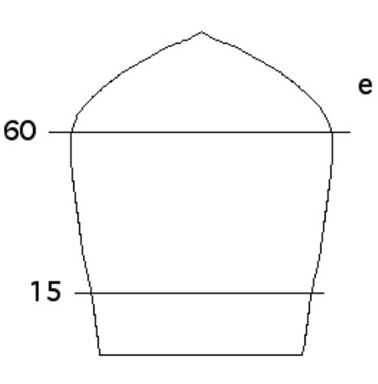
Spain and Italy. Those three countries both have an age pyramid shaped like an urn, indicating that the
birth rates are decreasing, while the mortality rate remains low until old age. This results in a high
number of people over 65, for which the virus leads to death more frequently than for younger people.
This could be a leading factor when it comes to the Mortality Index, as the index stays very low in the
younger part of the population and increases with age.
There were also a lot of countries where the mortality index, the life expectancy and median age is low
as e.g. in Africa. As COVID-19 is especially deadly for elderly people, we think that this could
influence the death rates, wherefore they might be higher in countries with an older population. Still
it is important to keep in mind that the ratio between deaths and confirmed cases is dependent on the
amount of tests that are being conducted. To give an example, the mortality index in Iceland is very
low, while the amount of cases per million is comparably high due to the extensive testing in Iceland
(Hermann, 2020). Despite the median age being in the middle range with 37 and a life expectancy of 83
suggesting a generally higher vulnerability to the virus, there are hardly any unexplained deaths since
almost every death has been accounted for by the number of identified cases. This case would thus
support the hypothesis that the index can help identify which countries have underreported cases based
on the death statistic (the higher the index, the more underreported cases). It is worth noting that an
underreporting does not necessarily signify an act of actively manipulating data but more often a
limitation of infrastructure and resources.
Discussion
To come back to our research question if demographics of individual countries influence the spread
of
COVID-19 as well as the deaths caused by the virus, we can say that there could be an influence of
the
age distribution on the amount of deaths. This statement is based on the fact that the mortality
rate
varies for different age groups, getting higher with higher age. Therefore, it is to be expected
that in
countries with a high life expectancy and more elderly people, the death rate is higher than in
countries with a low median age. To make clear statements if the demographics of individual
countries
have an influence on the spread and death rate of COVID-19, it would be important to have specific
information about infected persons. Our research is based on demographic information of a whole
country
and assumptions that in each age group the same amount of people is infected. The data is further
biased
by the fact that the total amount of tests that is being conducted, directly influences the amount
of
confirmed cases. Therefore, in countries such as Iceland where a lot of tests are conducted, the
death
rate compared to confirmed cases is low.
Regarding the research question about the index, we can conclude that countries such as Italy or
Spain,
which seemed to struggle quite heavily during the pandemic, have a lot more unexplained deaths
(higher
index) than other countries such as Germany or Austria. This could suggest that Italy and others (1)
underreported cases, leading to a higher than average ratio of deaths to confirmed cases or (2)
dealt
with the pandemic worse leading to more deaths than in a country that may not have been as
overwhelmed.
A third interesting point is looking at countries such as Sweden which went for a herd immunity
approach. Here, we can also observe a higher index than in countries which took more precautions.
Iceland, which tested much of its population displays a very low index, inversely supporting the
link
between underreporting cases and a high index. When checking the index for the different age groups,
it
becomes obvious that many of these unaccounted for deaths occur in the older half of the population.