
Water is essential for human survival. However, if it is polluted, it can cause serious damage to the human body. Children in particular are vulnerable to the harmful effects of polluted water, lack of water, lack of hygiene and poor sanitation. The lack of safe water, as well as inadequate hygiene and poor sanitation, cause diseases that account for about 18% of all deaths among children under five years of age (UNICEF 2006). This website aims to highlight the limited resource of water in the context of child mortality and relations to global urbanization in order to draw attention to a worldwide problem.
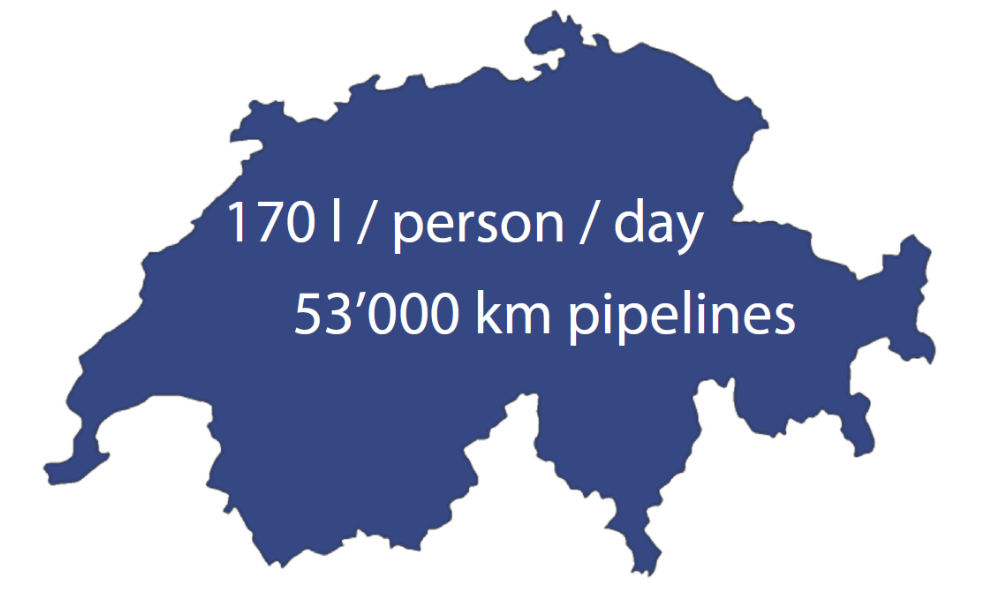
Access to fresh water is normally guaranteed in Switzerland. The Alps form a weather barrier, which leads the moist saturated air masses to higher altitudes, which results in above-average precipitation in Switzerland (Gurung and Stähli 2014). It is estimated that every Swiss consumes about 170 liters of water a day for drinking, cooking, washing and cleaning (Blanc and Schädler 2013). The Federal Office for Food Safety and Veterinary Affairs ensures the safety of drinking, showering and bathing water in Switzerland. It lays down requirements for this water to protect the health of consumers (BLV 2019). According to Blanc and Schädler (2013), these consumers are supplied by a 53,000 kilometer long network of drinking water pipes within Switzerland.
safe water and sanitation
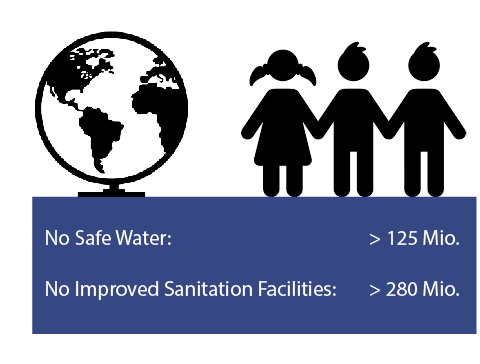
It is therefore all the more shocking that, according to UNICEF (2006), more than 1 billion people worldwide do not even have secure access to drinking water. In addition, according to the Children's Fund, more than 125 million children under the age of five grow up in households without access to safe drinking water and more than 280 million without access to improved sanitation facilities, which reduce the likelihood of contact with human excreta. It is through this contact that diarrheal diseases are transmitted. According to UNICEF (2006), around 2.6 billion people have no access to such improved sanitation facilities. And of these 2.6 billion people, around 2 billion live in rural areas. The question that now arises is how the situation will change with increasing global urbanization.
Urbanization is of great importance as the majority of people today live in urban areas. Urbanization and its implications on our
health are one of the most prominent issues in the agenda of the WHO in the current century (WHO 2019). Especially in developing countries,
the growth of urban populations is particularly high (Fink and Hill 2013). In their study, Fink and Hill (2013) figured out that child
mortality in urban areas is lower than in rural areas. Furthermore, the researchers described that children in large cities are better
off than children in small urban areas, despite problems such as air pollution, traffic and violence. The reasons for this are better
access to health infrastructure, better education or international investments in the cities. The UNICEF (2006) also recognizes that
access to fresh drinking water and improved sanitation facilities is more likely in urban areas.

Based on the existing literature we defined the following research question: "What is the relation between Urbanization and Child Mortality due to waterborne diseases?" Our hypothesis is that the child mortality due to waterborne diseases is lower when there is a high level of urbanization in a country due to the factors mentioned above. The goal of our website is to visualize what researchers predict and to find out if this relation is significantly visible on a global map and if yes, to what extent it is visible.
The interactive maps following subsequently were created using publicly available data from the World Health Organization (WHO). For the data processing and visualization, Microsoft Excel and the statistical computing IDE RStudio were applied. To be more specific, our team worked with assistance of a web application framework for R called Shiny. The shiny package enables the developer to create interactive web applications straight from R.
This first map displays the level of urbanization for each country, defined by the United Nations. The darker the blue, the higher the percentage of people living in urbanized areas. Use the slider bar to display a selected range of urbanization. The red circles display the ratio between child mortality due to waterborne diseases and the total child mortality numbers per country. The bigger the circle, the higher the ratio. By clicking on a circle the percentage of child deaths due to waterborne diseases is shown.
The following scatterplot displays the urbanization ratio (people living in urbanized areas divided by total population) and the child mortality ratio (child mortality due to waterborne diseases divided by total child mortality). The blue line is a regression line trying to fit the data. As visible in the plot there are a few outliers and the sum of square errors are in certain cases very high. By clicking on the graph you can see the corresponding values. Check the boxes to show the Spearman coefficient and the regression line summary.
Since both of the variables are not normally distributed, we applied the Spearman coefficient, which resulted in a moderate negative correlation. It seems like with higher urbanization, the child mortality ratio is lower. However, when we check the summary output, we have a very low R-squared value, suggesting that the regression line does not fit the data too well.
The data displayed with the help of the shiny package can be visualized and viewed in an appealing way. The following results should answer our point of view in a short discussion.
It is noticeable that the child mortality rate due to waterborne diseases is generally low, especially in the industrialized and emerging countries. It is also noticeable that the child mortality rate is significantly higher, especially in African and some Asian countries.
With regard to urbanization, it is striking that many countries with a higher child mortality rate due to waterborne diseases are less urbanized and more rural. This is consistent with the literature used and supports the hypothesis that urbanized regions have a lower child mortality rate due to waterborne diseases. However, some problems and limitations need to be discussed.
For our data, data sets have been specifically selected that can be attributed to water quality. Other factors have not been included in child mortality. This fact must always be borne in mind in order not to draw provisional conclusions about general child mortality.
There are also some limitations. One is the definition of "urbanization". What criteria must be met to define an area as "urban"? Since the data for urbanization were not generated by us, the train of thought arises as to how suburbs or agglomerations, for example, were treated. This could have a decisive influence on the total urbanization of a country on average.
The biggest limitation is that the international scale of urbanization and child mortality is too inaccurate for a final assessment, as no data were collected per country showing child mortality due to waterborne diseases in urbanized and rural areas. In extreme cases, child mortality could be extremely high due to waterborne diseases in the urban areas of a country. But if the country only had few such urban areas, it would still be displayed as a rural area in average on the shiny-map. Therefore, these results should be treated with caution and these considerations should be taken into account.
The Spearman coefficient showed a moderately negative correlation between the urbanization level and child mortality ratio. However, the regression analysis did not perfectly fit the data; child mortality ratio is not fully explained by the urbanization level. A statistically established correlation is not yet proof of an actual connection between variables anyway and does not indicate causality.
This work has been done as part of the module GEO 878 taught at the University of Zurich. Our team consists of three students, who are all pursuing a Master in GIS at the Department of Geography here in Zurich. If you have any questions or comments please feel free to contact us!
Shiny bright like a diamond
Alice was born in Milano, grew up in Barcelona and lives in Zurich now.
Shiny, but not shy
Marc was born in Zurich, grew up in Zurich and lives in Zurich now.
Notorious Moonshinyer
Julian was born in Münsterlingen, grew up in Heldswil and lives in Zurich.
