Home About Renewable Energy Interactive Map Stories About us
ecology

RENEWABLE ENERGY
IN EUROPE

Geo878: Geovisualization - Webpage Project

Department of Geography | University of Zurich

The project contains of the two main parts: making an responsive web-page and making and integrating responsive and nice R-Shiny map related to the topic of the web-page. Our two-man team has decided on the topic of renewable energy, which is reffering to the Sustainable Development Goal Nr. 7 - Affordable and Clean Energy.

Research Question: Which trends related to renewable energy consumption are the countries of Europe following in the time period of 1990 - 2014?

Instead of answering the research question in just a few senteces, we want to provide different information sources to explore the research question and find possible answers. In the first section of this webpage you can read interesting facts about European production and consumption of renewable energy. This section is followed by an interactive map, in which you can find out more about the renewable energy consumption of the European countries. In the Stories sectin we present ten European countries in more detail.

Methods
The web-page is written in HTML and CSS, while the R-Shiny map is mad in R-Studio.

We hope you will enjoy checking our web-page and its content as much as we enjoyed working on it.

About renewable energy

What are renewable ressources?

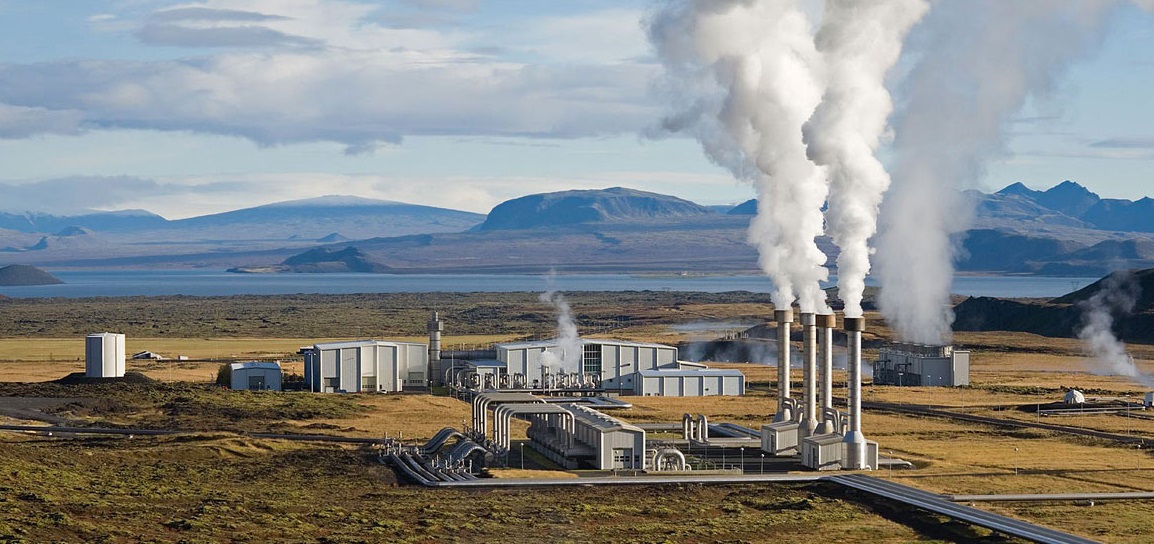
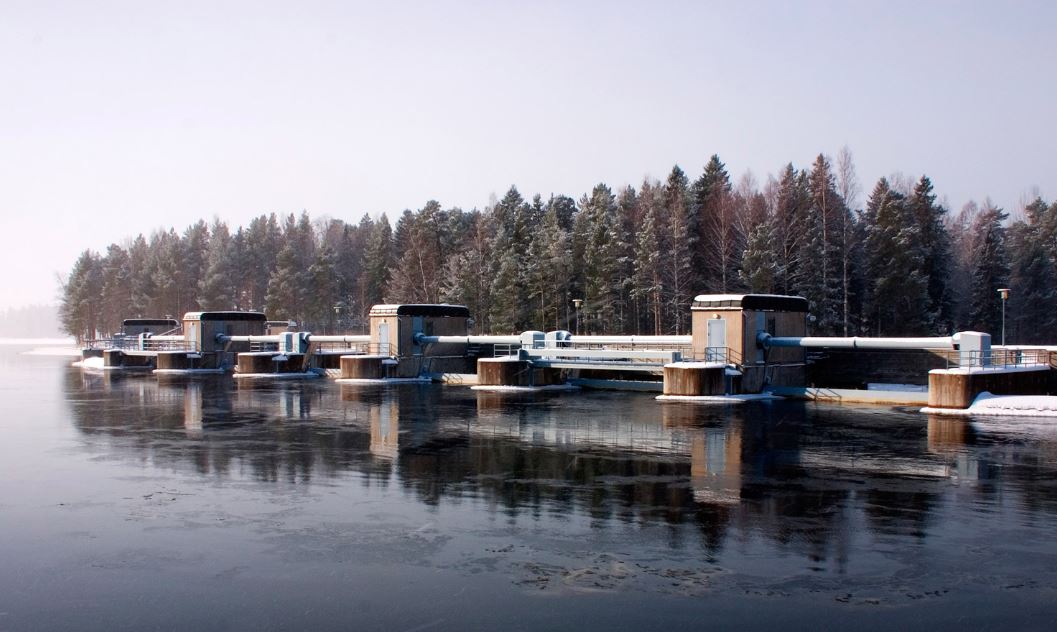
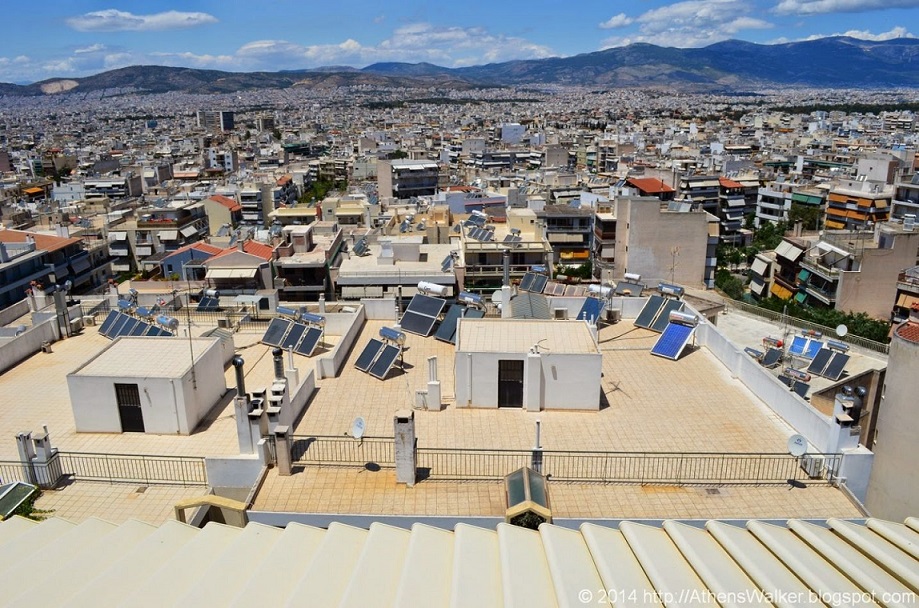
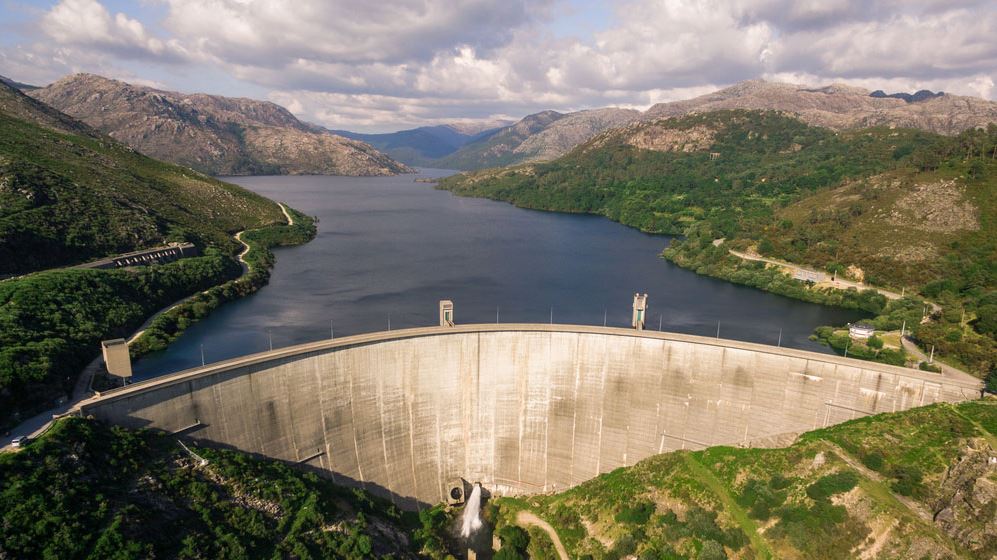
Renewable energy is a type of energy collected from never-ending, renewable resources, such as sunlight and heat, wind, water (rain, river-stream, tides, wawes), geothermal energy and bio-waste. It is mostly used for the production of electricity and the heating or cooling of air and water. While fossil fuels are non-renewable, that is, they draw on finite resources that will eventually dwindle, becoming too expensive or too environmentally damaging to retrieve, many types of renewable energy resources are constantly replenished and will never run out. In 2017, around 20% of global energy production came from renewable energy sources.

Learn more / source: Renewable energy World

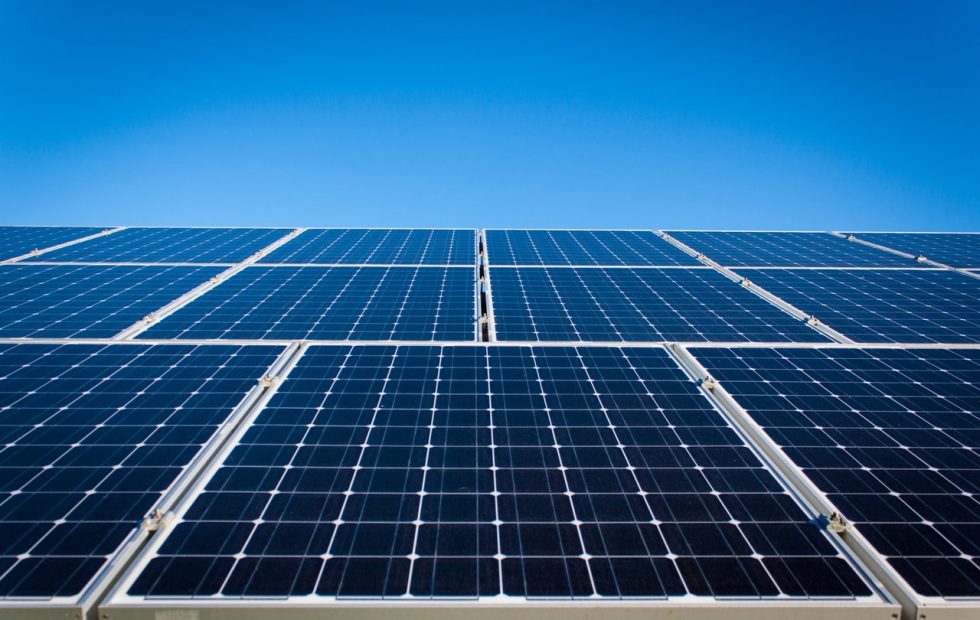
Photo source: Solar panel


Shouldn't we use it even more?

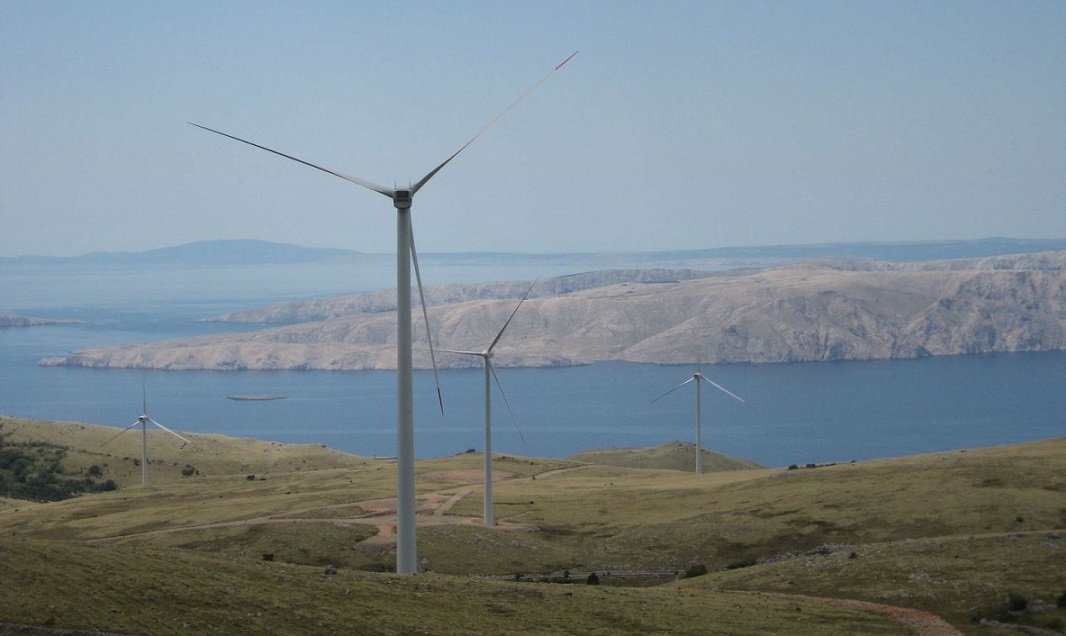
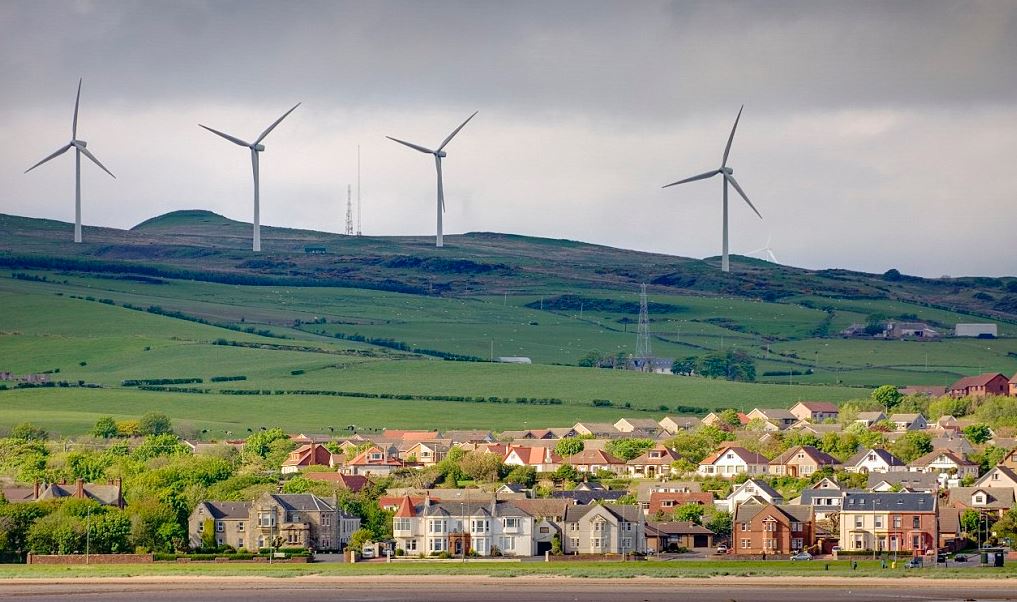
Of course we should! However, there are some reasons this type of energy is more expensive - or rather, less popular - to produce and to use than fossil fuel energy. Favorable renewable resources are often located in remote areas and it can be expensive to build power lines from the renewable energy sources to the cities which need the electricity. In addition, renewable sources are not always available, that is, clouds can reduce electricity from solar power panels; days with low or too strong wind reduce electricity from wind farms, and droughts reduce the water available for hydropower. Furthermore, some people might argue that some other ecological problems come with this type of energy production - for example, the impact of wind turbines on wildlife, most notably on birds and bats, has been widely documented and studied. New technologies should, however, decrease negative impact on the wildlife. The future is really exciting!

Learn more / source: Union of concerned scientists


Sustainable Development Goals

The Sustainable Development Goals (SDGs) should be reached by all UNO-members until 2030. One from 17 goals concerns about affordable and clean energy. The targets of this goal are:

  • By 2030, ensure universal access to affordable, reliable and modern energy services.
  • By 2030, increase substantially the share of renewable energy in the global energy mix
  • By 2030, double the global rate of improvement in energy efficiency
  • By 2030, enhance international cooperation to facilitate access to clean energy research and technology, including renewable energy, energy efficiency and advanced and cleaner fossil-fuel technology, and promote investment in energy infrastructure and clean energy technology
  • By 2030, expand infrastructure and upgrade technology for supplying modern and sustainable energy services for all in developing countries, in particular least developed countries, small island developing States, and land-locked developing countries, in accordance with their respective programmes of support
  • Learn more / source: Sustainable Development Goal

    Title image source: Link


    Interactive Map

    How to use:

    The map shows all countries of Europe displaying the amount of their renewable energy consumption relating to the total national usage. With the slider below one can choose the year of interest and the map refreshes automatically. On the bottom left there is a line chart showing the consumption of renewable energy of a certain country over time. The country can be selected by clicking on it on the map. The orange point on the line chart is reffering to the year of interest.


    Comment on the data

    The data is provided by THE WORLD BANK - Data section (Link). The dataset contains the annual values of the relative renewable energy consumption of every country (if the data is in some form available). All of their data is provided without any charge. According to their website, the World Bank works closely with the international statistical community including the agencies of the United Nations (UN), the Organisation for Economic Co-Operation and Development (OECD), the International Monetary Fund (IMF) and the regional development banks.

    Comment on the cartographic elements

    Choropleth map:

    According to Rase (Rase 2016: 12) is data, which is visualized with a choropleth-map, generally made of relative quantities. This is the case concerning our data. It makes sense to have a look at relative data (the relative amount of renewable energy consumption in relation to the total energy consumption of a country) here, since a comparison of the total amount of energy consumption is dependent on the size of a country. Furthermore, a choropleth map does not deform the country borders as e.g. a cartogram. We deliberately made this choice since we want this interactive to be as user-friendly as possible, particularly for people which are not that strong in spatial thinking.

    (Rase, Wolf-Dieter 2016: Kartographische Oberflächen: Interpolation, Analyse, Visualisierung. Books on Demand, 340 pages.)

    Colors and number classification:

    We decided to use a single-color scheme, since the visualized data has just one thematic aspect, which goes from a low to a high relative amount. The choice of the color blue has following reasons: Since renewable energy consumption is connected to some positive feelings, we should decide on a strong color such as blue. Alarming colors such as red are indication something more critical or less positive. Furthermore, the color blue is a component of the whole layout of our webpage.
    The values are not divided in equally large ranges which has a reason: While most countries have still a relatively small amount of renewable energy consumption (REC), most data is in the lower half considering their amount of REC. Therefore, it makes sense to have smaller ranges in the lower part of our data to show these small differences in a more efficient way. Only a few countries show extremely large values in comparison to all the other countries of Europe and can therefore be considered as extreme values. Avoiding to have empty classes, the ranges of the higher values are larger then the ones below.

    Basemap and Projection:

    We decided to choose a rather simple base map with less colors and toponyms on it. Countries are visualized in white while the sea has the color grey. This is perfect for our map, since the grey color does not disconcert the blue color scheme of the choropleth-map. Furthermore, the white color of the countries does not have any influence on the semi-transparent choropleth-map.
    For the whole base-map including the polygon-layer of the European countries the well-known Mercator projection is used. This cylinder-projection deforms the shapes of the countries in direction of the cylinder-axis but provides an isogonal projection. Due to our focus on Europe, which also corresponds to the default zoom-level, we decided that this projection type fits best for our map.

    Animation:

    The map does not include any automated changes. With the slider-bar the year of interest can be changed, which also leads to a change in the choropleth-map. To avoid animation blindness the values of the countries are always displayed when hovering with the computer-mouse over it. The main focus on providing the data of every year since 1990 on our map is to detect major trends in the development. For example a direct switch from 1990 to 2014 shows a distinctive change from very light-blue in the middle-east part of Europe to a darker blue.

    Stories

    The gallery we present here contains stories of different types of renewable energy across all regions of Europe. We tried to present diversity in the production of energy from the renewable sources. Some of the following countries presented might not be in the top places of the renewable energy production, however we tried to put emphasis on possibilities in the development.


    1 / 10
    Croatia - Windpower in dry Dalmatia

    In most of the region of Dalmatia (south Croatia), there is just enough wind through the whole year to produce energy for many of its inhabitants. Ideally, the wind should not be too strong nor too weak. Today, more and more windmills are installed in Dalmatia, on the coastline, the islands and even on the mountains. Wind power, combined with hydropower, and other renewable energy sources, provide Croatia almost third of the energy production as of 2014 - significant increasment from 1990. The picture shows wind farm near Senj.

    Text source: Poslovni.hr | Image source: Senjska bura
    2 / 10
    Iceland - Cold air heated by warm underground

    Iceland is a pioneer in the use of geothermal energy for space heating. Generating electricity with geothermal energy has increased significantly in recent years. Geothermal power facilities currently generate 25% of the country's total electricity production. In 2014, roughly 80% of primary energy use in Iceland came from indigenous renewable resources. Only 15 years before it was 55%. The picture shows Nesjavellir geothermal power station, situated close to Iceland's capital of Reykjavik.

    Text source: Orkustofnun.is | Image source: Union of concerned Scientists <
    3 / 10
    Sweden - best in the European Union

    Sweden has invested heavily in the search for alternative energy sources ever since the oil crisis of the early 1970s. In 1970, oil accounted for more than 75 percent of Swedish energy supplies; today, the figure is around 20 percent, chiefly due to the declining use of oil for residential heating. Because of the industry, only a few countries consume more energy per capita than Sweden. However, Swedish carbon emissions are low compared with those of other countries. The reason for this low emission rate is that 83 percent of electricity production in Sweden comes from nuclear and hydroelectric power. The plan for the future is to use less of the nuclear power while increasing usage of the hydropower. The picture shows power plant on Lule river.

    Text source: Sweden.se | Image source: Vattenfall.uk
    4 / 10
    Greece - Sunshine could provide much more energy

    In 2016. Greece had a share of renewable energy in total energy consumption below the average of the European Union - having share of only 16% in total energy usage (which is still double compared to 1990). However, it is also one of the sunniest countries of the continent. The new goal, supported by European Investment Bank in 2017, is to support small-scale wind farms and solar panels at sites across the country, including on the islands of Kefalonia, Chios, Lesvos, Crete, Mykonos, and some others, as well as on the mainland in Karditsa. The picture shows tops of the buildings in Athens, where water is heated with small solar panels.

    Text source: European Investment Bank | Image source: Athens Walker
    5 / 10
    Portugal - electricity producion gained from renewable sources only

    In March of 2018., Portugal’s renewable electricity production exceeded monthly consumption for what is likely the first time. The average renewable generation for the month exceeded 103% of consumption. It almost certainly won’t be the last time. The country is predicting that renewables will satisfy its mainland electricity needs by 2040, ultimately eliminating the electricity sector’s greenhouse gas emissions. Hydropower is the most important energy source in Portugal (about 55% of produced energy), followed by wind power and bioenergy. The picture shows dam of Vilarinho Da Furna, north Portugal.

    Text source: Sun&Wind Energy | Image source: Mother Nature Network
    6 / 10
    Norway - enough water and wind for almost all of their needs

    Despite the fact that Norway is one of the top producents of oil in Europe, being second after only Russia, impressive 98% of electricity production in this country comes from renewable sources. While hydropower is the source of most of the production, thermal power and wind power are significant as well. Interestingly, while energy from solar power presents less than 1% of the energy used, this is a growth of over 350% in last two years.

    Text and image source: evwinds.es
    7 / 10
    Germany - (Bio)Abfall ist kein Müll

    Germany is one of the top productions of biogas - bioenergy covers 5 percent of the overall energy needs in Germany as of 2015. In the future, this number should reach 20 percent, according to the European renewable energy action plan set for 2020. Bioenergy is a very effective source of energy and most of the EU member states see their future exactly in this type of energy. Germany however should increase usage of the renewable sources even more, having share of only 13%. The picture shows Weltec biogas plant in Vechta, north-west Germany.

    Text source: Biomassa.de | Image source: WELTEC.com
    8 / 10
    Switzerland - High mountains with plenty of shine

    Historically, Switzerland's longest-serving and most important source of renewable energy have been hydropower. But the new renewables including solar, wood, biomass, wind, geothermal and ambient heat also play an increasingly important role in today's Swiss energy mix. The picture ilustrates how solar panels can be instaled even on high Alpine mountains.

    Text source: Swiss Federal Office of Energy | Image source: eawag.ch
    9 / 10
    Latvia - Baltic country that uses its rivers

    Latvia is dependent on imports for its primary energy resources. Lacking fossil resources, Latvia has a high level of import dependency on oil and gas, imported mainly from Russia. Hydropower and gas provide most of the domestic supply of electricity, with wind and, especially, biomass contributing to the mix in recent years. Self-sufficiency in energy supplies reached 40% in 2014, being more than double compared to 1990. The picture shows power plant on Latvia's longest river, Daugava.

    Text source: Renewable Energy in Latvia | Image source: CTBR.com
    10 / 10
    Scotland - Plans for future are both optimistic and realistic

    Scotland might not be one of the sunniest places of Europe, but the wind makes it up for it. The electricity is produced almost exclusevly out of wind energy, so much that they can even export it. The objectives outlined in the Renewables Scotland 2030 report go beyond individual energy sources or initiative. If met, they would allow Scotland to break free from fossil fuels and establish itself as a leader in renewables to the benefit of not only the environment but the nation and its citizens as well. This might encourige other parts of the United Kingdom, since only 7% of the energy comes from the renewable sources. The picture shows small wind farm on the east coast, one of many in the country.

    Text source: Futurism | Image source: DailyMail


    About us

    Working on project bigger than 3 ECTS points.

    We are a small but yet enthusiastic team of two Geography students of the University of Zurich. Our goal with this project is to develop our knowledge of R even further, explore secrets of HTML, and even more important, to learn about renewable energy usage in Europe and its significance.

    Without any further ado, this is us:

    Boss

    Thomas Mathis

    R-Shiny Master

    "My life is suffering. Oh, I ment surfing"

    thomas.mathis3@uzh.ch

    Boss

    Tomislav Grcic

    HTML Master

    "Unless it's free, I cannot afford it."

    tomislav.grcic@uzh.ch