Welcome to our Geovisualization Project Website
This website is created within the Master's course GEO878 which takes place at the Department of Geography at the University of Zurich. The overall aim of
the website is to demonstrate potential applications of maps and geographic information in a web context.
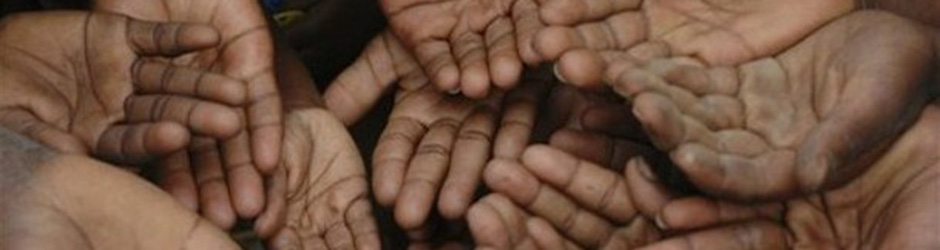
Thematically, the overall topic of the website are the UN Sustainable Development Goals and more precisely the goal No. 1 "No Poverty" or in full version "End Poverty in all its forms everywhere."
This topic is chosen because poverty, in contrast to some other goals, penetrates all areas of a human’s life and makes it (nearly) impossible for the affected people to live a healthy, “normal” life. Furthermore, we regard the goal of ending poverty to some
extent as a precondition to reach some of the other development goals.
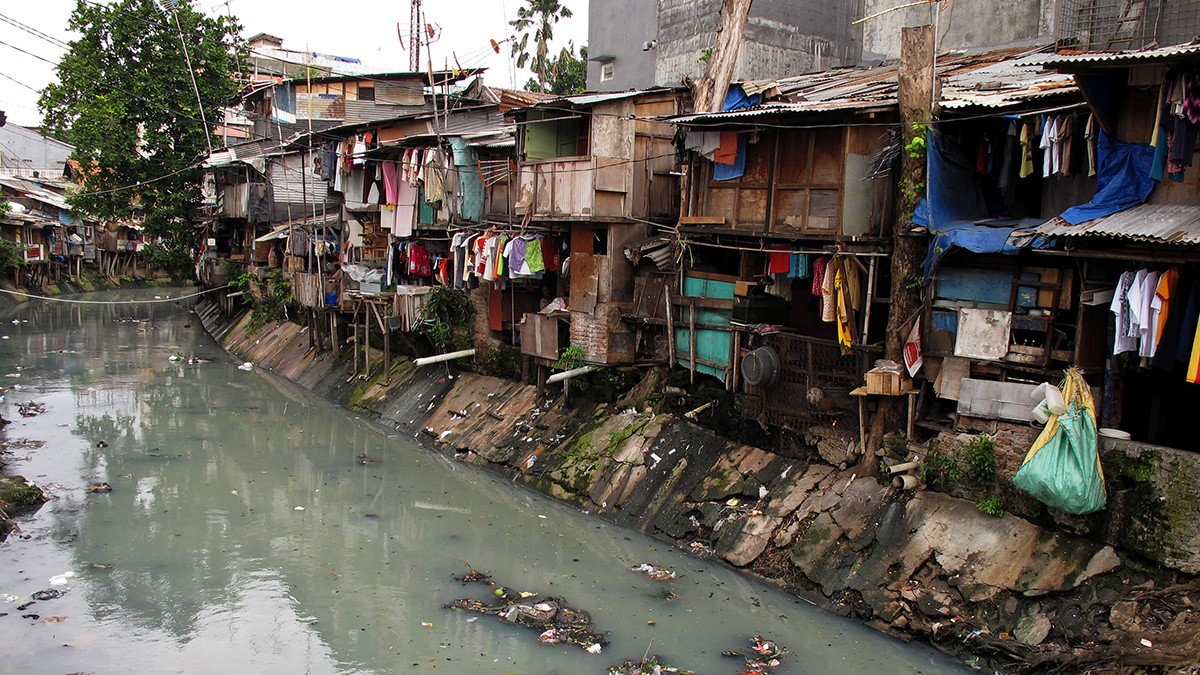
A common way to analyze the degree of poverty in a country is to use a monetary measure. One such measure is the Head Count Ratio. But poverty does not only mean living with a very limited amount of money but also e.g. not having enough food and thus being undernourished, not having access to health institutions and thus being exposed to a higher mortality probability or not being able to afford education. Therefore, another measure may capture poverty more accurately. A measure that takes these aspects and many more into account is the Multi Dimensional Poverty Index which is developed by the Oxford Poverty & Human Development Initiative (OPHDI).
In detail this research project is concerned about the goal’s target 1.1 “By 2030, eradicate extreme poverty for all people everywhere, currently measured as people living on less than $1.25 a day” and more important in a second step about the goal’s target 1.2 “By 2030, reduce at least by half the proportion of men, women and children of all ages living in poverty in all its dimensions according to national definitions.” which includes the multidimensional aspect of poverty.
Derived from this the research questions of this project are: Where do people still live in poverty (accodring to the different measures) and which
aspects influence their poverty most?
Please study the maps and the scatter plot (under "Visualization") to find an answers to these questions. For more information about the poverty measures click on this site on the cursive words or go to "About Poverty". Background information about the used data you can find under "Resources".